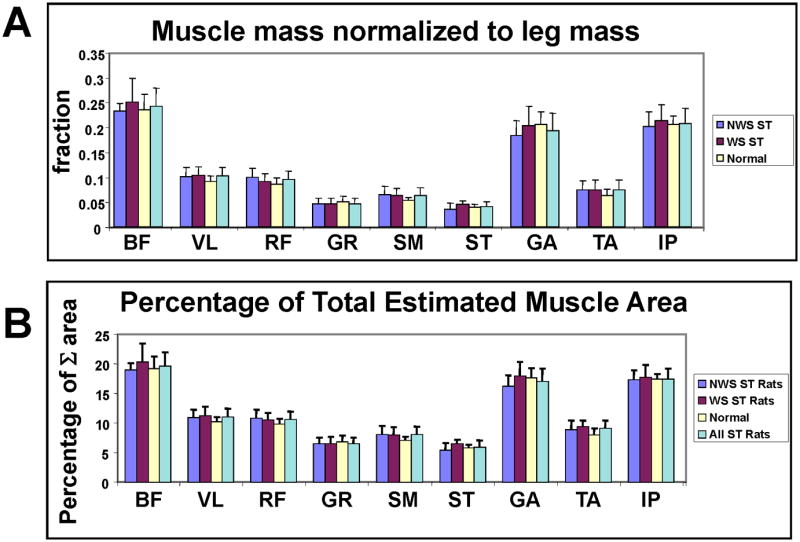
Figure 6.

A. Muscle Masses of the leg normalized to leg total muscle mass. NWS ST group (dark grey) WS ST group (black) N normal group (white), All ST rats (light grey). Muscles: 1. BF biceps femoris, 2. VL vastus lateralis, 3. RF rectus femoris, 4. GR gracilis, 5. SM semimembranosus, 6. ST semitendinosus, 7. GA gastrocnemius, 8. TA tibialis anterior, 9. IP iliopsoas, 10. TB forelimb triceps and 11. BB biceps brachii. Vertical bars : standard deviations. There were no significant differences in post-hoc t-tests with Bonferroni corrections. Note lowered standard deviations and increased similarities compared to Figure 5.
B. Percentage of estimated muscle area as a fraction of summed leg muscle estimated areas, obtained applying a non-linear scaling. NWS ST group (dark grey) WS ST group (black) N normal group (white), All ST rats (light grey). All spinalized combined (cyan). Muscles labeled as in A. Vertical bars : standard deviations. Note similarity across groups and the reduced variance after these normalizations and scalings compared to Figure 5. Data not previously published.
