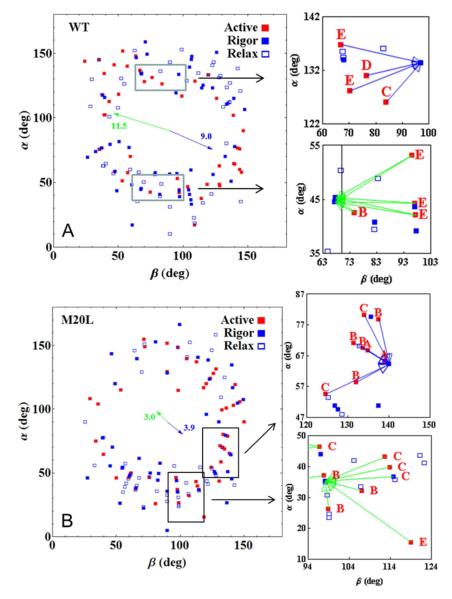
Figure 5.
Dipole moment spherical polar coordinates (β,α) scatter plot for fibers in rigor (blue solid square), isometric contraction (red solid square), and relaxation (open blue square) and for the WT and M20L species. Coordinates are defined relative to a lab frame z-axis parallel to the fiber symmetry axis, x-axis in the plane of the coverslip, and y-axis normal to the coverslip plane pointing into the aqueous medium. Right panels show enlargements of the rectangular regions in the scatter plots. They depict the arrow clusters associating various high free-energy active isometric coordinates in sub-states A-E (Figure 3) at the base of the arrow with their unique minimum free-energy rigor A-state at the pointy ends. Blue or green arrows designate a positive or negative projection scalar (eq. 3). Arrow clusters like those in the enlargements populate the entire scatter plot but were left out here for clarity. The full set of clustered arrows for WT and all mutant species is shown in Supporting Information (Figure S3). Blue and green arrows arranged like the hands of a clock are the average orientation of all the same colored clustered arrows (including those not shown here outside of the rectangules). They are referred to in the text as (±) and have amplitudes proportional to the average free-energy separating the isometric active cross-bridge from the minimum free-energy rigor A-state cross-bridge computed using eq. 2.

