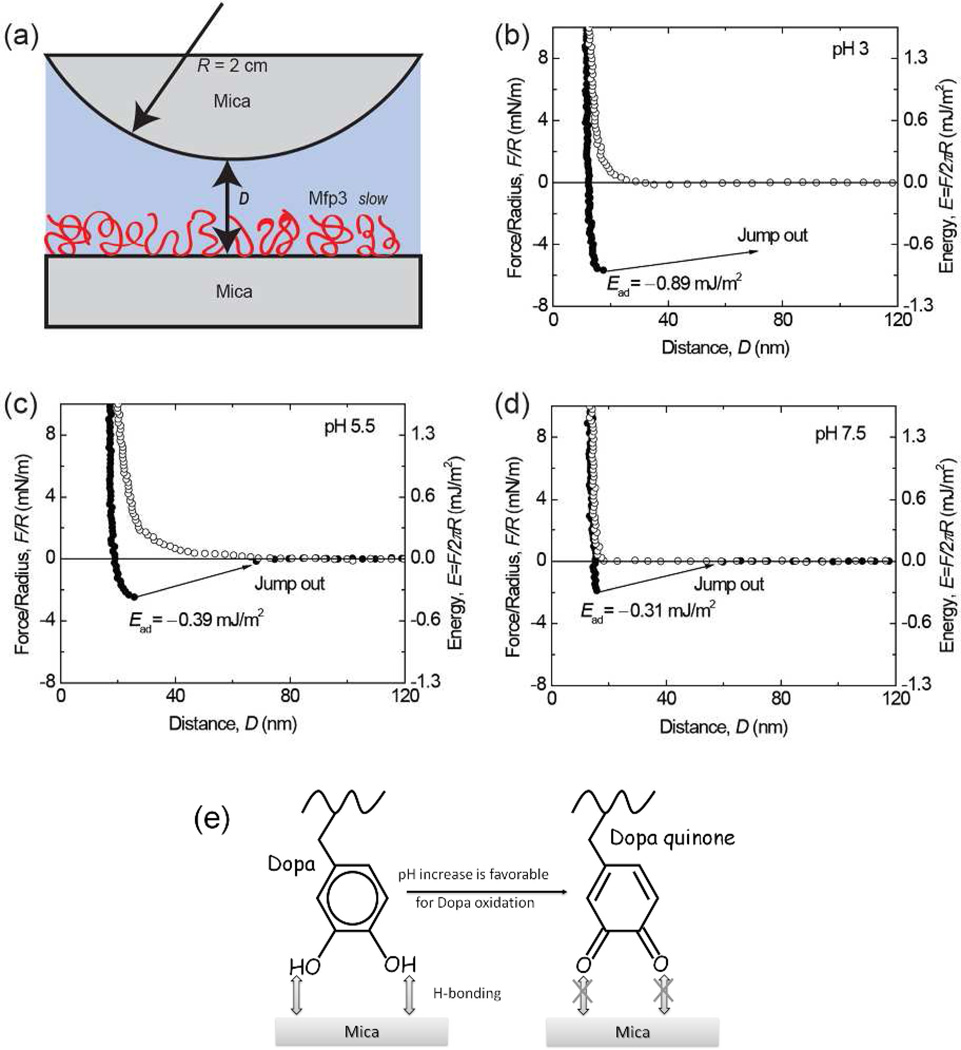
Figure 3.
Interaction between mica and Mfp3 slow adsorbed to mica at pH 3 (b), 5.5 (c), 7.5 (d). The y axis on the left gives the measured force, F/R (normalized by the radius of the surface), whereas the y axis on the right gives the corresponding adhesion energy (E) per unit area between two flat surfaces, defined by E=F/2πR. Approach (unfilled symbols); separation (filled symbols). Separation followed a brief (~3–5 min) contact. (e) The interaction between Dopa and mica is H-bonding, which decreases as pH increases due to Dopa oxidation.

