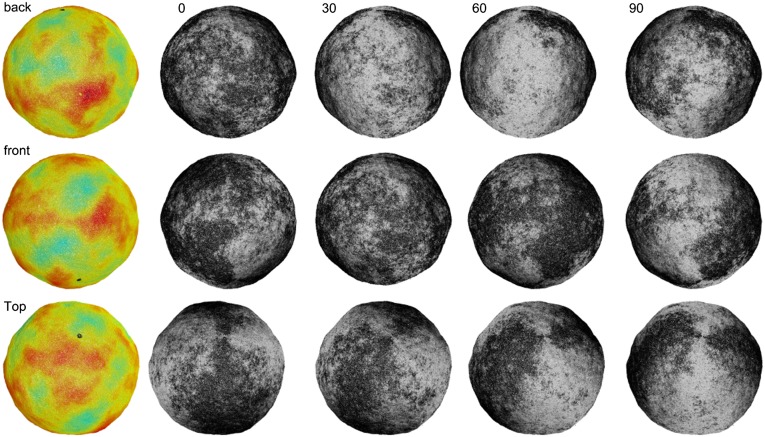
Fig. 6.
Shape and defect configuration for a simulated vesicle with high translational viscosity and low rotational viscosity. The color images (Left) represent distance from the center of mass of the vesicle, and the grayscale images (Right) represent the tilt direction, showing the optical intensity that would be observed with polarized fluorescence microscopy. This vesicle has only two defects of charge +1, which is the minimum required by topology. Note that it is much smoother than the simulated vesicle of Fig. 5.

