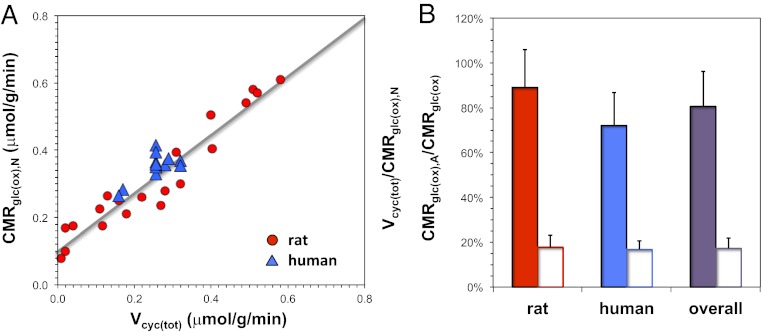
Fig. 2.
In vivo 13C MRS experiments reporting rates of neurotransmitter cycling [Vcyc(tot)] and glucose oxidation in neurons [CMRglc(ox),N] and astrocytes [CMRglc(ox),A]. (A) Values of Vcyc(tot) and CMRglc(ox),N for rat (red circles) and human (blue triangles) cerebral cortex. The rat data represented many activity levels in the somatosensory cortex, whereas the human data were from the awake resting state in the visual cortex with varying degrees of gray vs. white matter partial volume (Table S3). Linear trends between changes in Vcyc(tot) and CMRglc(ox),N suggest strong coupling between neurotransmitter activity and energy metabolism [R2 = 0.92, where CMRglc(ox),N = 0.87 Vcyc(tot) + 0.10], where the finite intercept ranging between 0.05 and 0.15 μmol/g per minute indicates energy consumption for nonsignaling conditions. (B) Ratios of Vcyc(tot)/CMRglc(ox),N in the nonanesthetized awake resting state (filled bars) (Table S3) and CMRglc(ox),A/CMRglc(ox) for all conditions above isoelectricity (open bars) (Table S4) in rat (red), human (blue), and overall (purple). Similarity between the Vcyc(tot)/CMRglc(ox),N ratios (filled bars) in rat and human suggests that the relationship between Vcyc(tot) and CMRglc(ox),N in both species may be conserved. Likewise, correspondence between the CMRglc(ox),A/CMRglc(ox) ratios (open bars) suggests that the relationship between CMRglc(ox),A and CMRglc(ox) across species could be similar.

