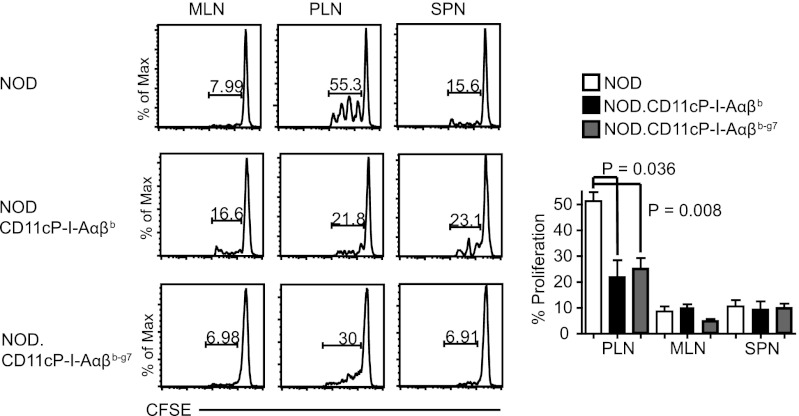
Fig. 4.
Enhanced Treg function in NOD.CD11cP-I-A(α)βb and NOD.CD11cP-I-Aαβb-g7 mice correspond with decreased antigen-induced proliferation of diabetogenic T-cells in the PLNs. In vivo proliferation of 8.3-CD8+ T-cells in the PLN and MLN of NOD (n = 5) vs. NOD.CD11cP-I-Aβb (n = 3) and NOD.CD11cP-I-Aαβb-g7 (n = 5) mice. 8.3-NOD splenic CD8+ T-cells (5 × 10⁶) were labeled with CFSE (0.5 μM) and injected into respective hosts. SPNs, PLNs, and MLNs were analyzed for the dilution of CFSE via flow cytometry 7 d later. Shown are representative flow cytometric profiles (Left) and averaged percentages of CFSE dilution ± SEM (Right). P values were calculated using Mann–Whitney U test.

