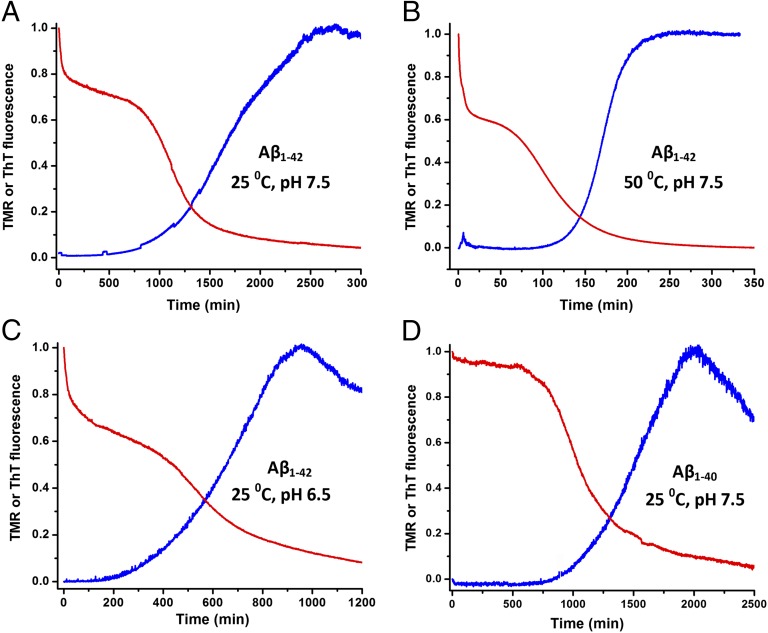
Fig. 2.
Time courses using TMR (red) or ThT fluorescence (blue) under various conditions. A–C use unlabeled or TMR-labeled Aβ1–42 at (A) 25 °C, pH 7.5; (B) 50 °C, pH 7.5; and (C) 25 °C, pH 6.5. (D) Time course of unlabeled and TMR-labeled Aβ1–40 at 25 °C, pH 7.5. All buffers contained 150 mM NaCl, 1 mM EDTA, and 5 mM βMe. The unlabeled Aβ samples contained 2 µM ThT and were monitored at an emission wavelength 470 nm with excitation at 438 nm. The data were normalized for comparative purposes.

