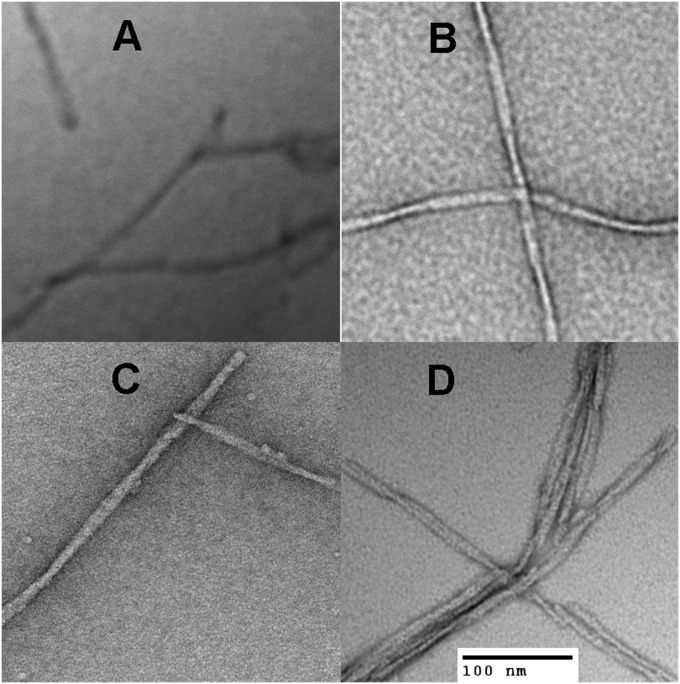
Fig. 3.
Negative stain electron microscopy images of Aβ fibrils collected from the endpoints of the experiments shown in Fig. 2 prepared in pH 7.5 and incubated at 25 °C. (A) unlabeled Aβ1–42, (B) unlabeled Aβ1–40, (C) TMR-Aβ1–42, and (D) TMR-Aβ1–40.

