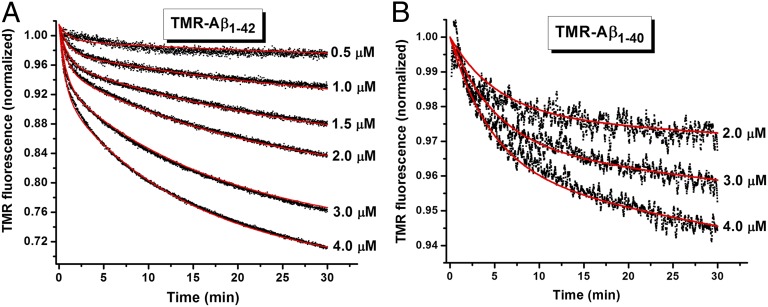
Fig. 4.
Oligomerization of TMR-labeled Aβ. Time course of fluorescence change following dilution of a 100 µM stock solution containing monomeric (A) TMR-Aβ1–42 or (B) TMR-Aβ1–40, prepared in 4 M GdnCl, to final concentrations from 0.5 to 4.0 µM in 20 mM phosphate buffer at pH 7.5 containing 1 mM EDTA and 5 mM βMe. The black dots represent data, and the red lines are global fit of the data using a monomer-dimer-trimer model as described in Scheme 1. The rate constants obtained are summarized in Table 1. In all of the samples, the final concentration of GdnCl is 0.16 M. All experiments were performed at 25 °C without stirring.

