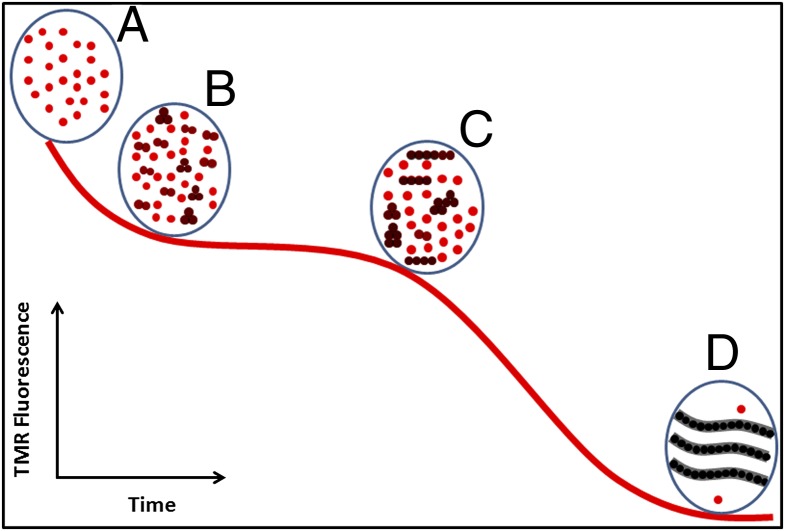
Fig. 8.
Schematic view of aggregation based on time course of TMR fluorescence. The red curve is a typical fluorescence time course of TMR-Aβ. (A) Monomeric ensemble at t = 0, (B) small oligomers predominantly dimers and trimers formed during the oligomerization phase, (C) small oligomers cluster to larger oligomers during the intermediate or lag phase, and (D) β-structured fibrillar aggregates are formed and the solution is monomer depleted.

