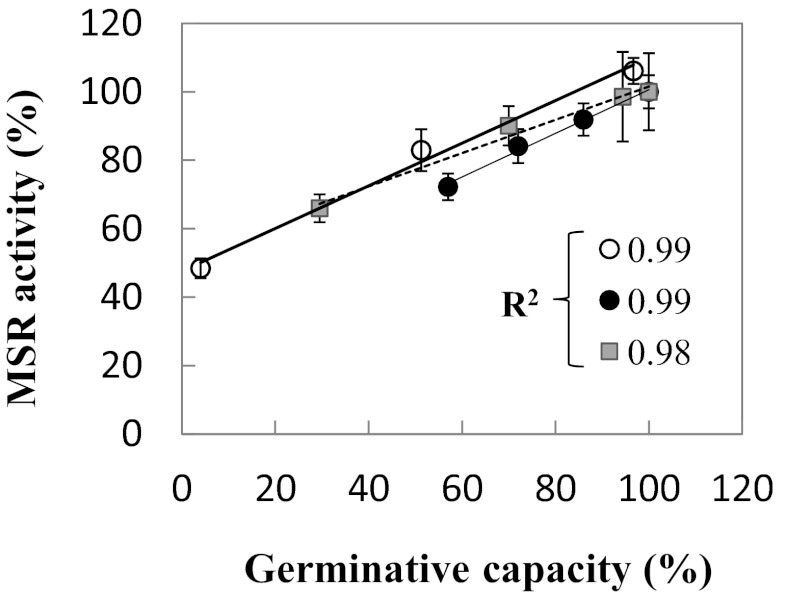
Fig. 3.
Relationship between MSR activity and germination capacity of seeds. The level of MSR activity measured in seeds before and after deterioration (Fig. 2) was expressed as the percentage of activity determined in control mature seeds and plotted against the percentage of seed survival. White circles represent maturing Jemalong seeds; black circles, mature Jemalong seeds; gray squares, mature DZA315-16 seeds. The R2 correlation coefficients of linear regression for each set of values are indicated.

