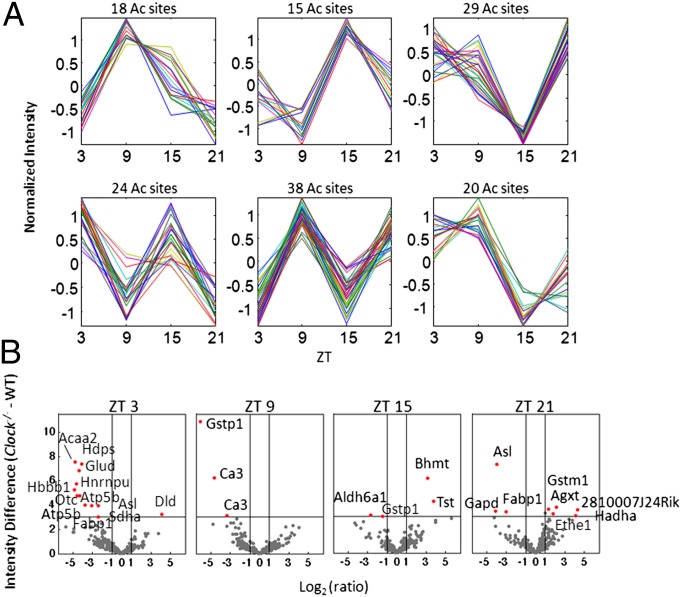
Fig. 2.
Clustering and differential analysis of the circadian acetylome. (A) The k-means clustering of the WT acetylation profiles after normalization of each profile (mean = 0 and variance = 1), using Pearson correlation as the similarity measure with k = 12. Shown are 6 of the 12 clusters with their corresponding number of acetylation sites. (B) Volcano plots show the significance versus fold-change in raw values between the Clock−/− and WT acetylation levels, at each ZT. x-axis, difference in intensity (Clock−/− - WT); Y-axis, –log10 of the CyberT (64, 65) P value comparing Clock−/− and WT acetylation intensities. Protein labels refer to corresponding acetylation sites that are significantly different between Clock−/− and WT liver with a P value less than 0.001 and a raw acetylation intensity fold-change of at least 2.

