Fig. 3.
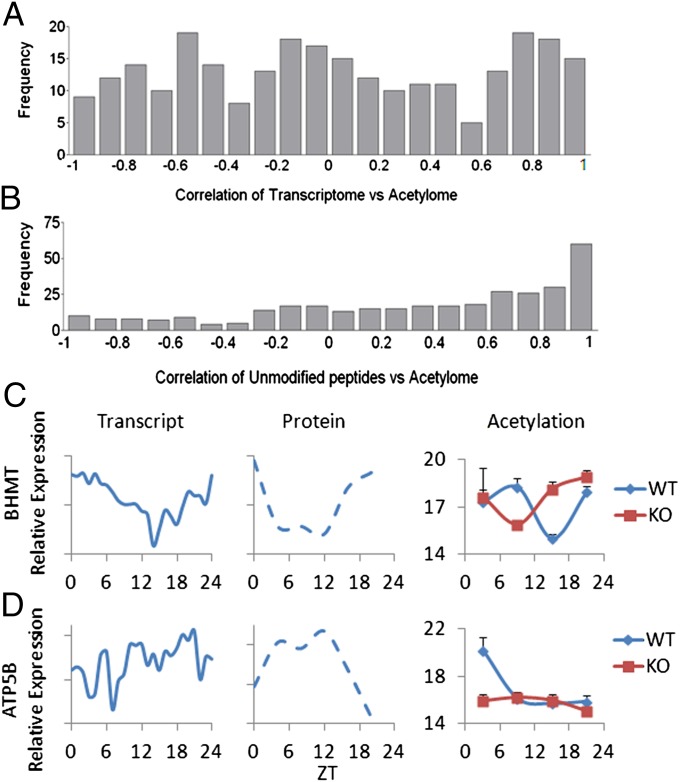
Correlation analysis between circadian transcriptome, unmodified peptides, and acetylome. (A) Histogram of Pearson correlations between acetylation profiles and the corresponding gene expression profiles from previously published transcriptome data (40, 41). (B) Histogram of Pearson correlations between acetylation profiles and the estimated protein profile obtained from the unmodified peptide profile (Fig. 1) (67, 68). (C) Previously published gene expression (40, 41) and protein profile (47) for betaine-homocysteine methyltransferase along with the acetylation profile of its acetylation site (JTK cycle P value of 0.0418). (D) Previously published gene expression (40, 41) and protein profile (47) for ATP5B along with the acetylation profile of its most differentially acetylated site (JTK cycle P value of 0.0418).

