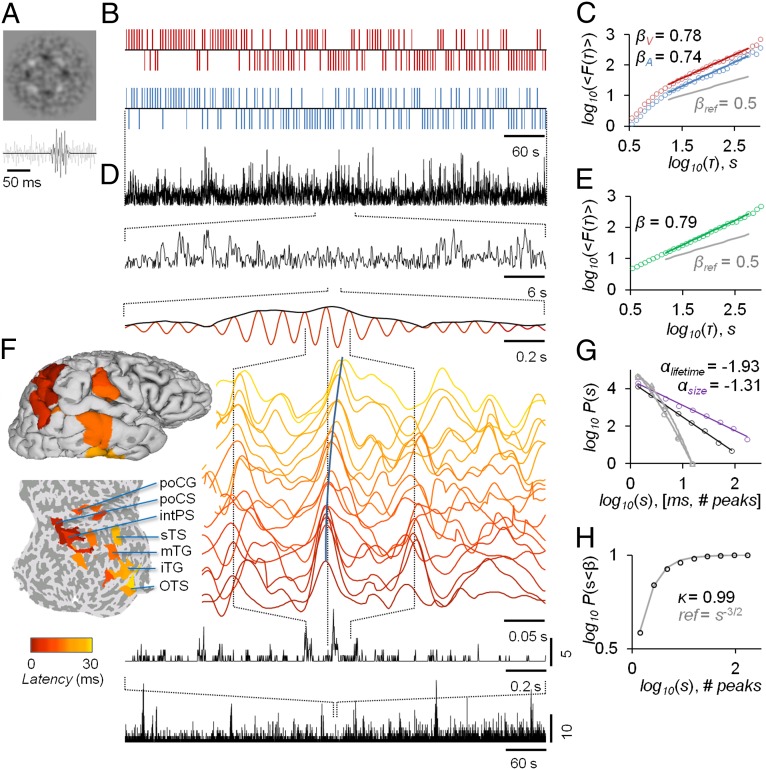
Fig. 1.
Paradigm for mapping individual behavioral and neuronal scaling laws with TSDTs and source-reconstructed M/EEG recordings. (A) Examples of noise-embedded visual and auditory stimuli whose SNRs are tuned before the experiment to yield an ∼50% hit rate and then kept constant (Fig. S1). (B) Behavioral performance time series of detected (upward ticks) and undetected (downward ticks) display rich dynamics in a bimodal audiovisual TSDT (visual, red; auditory, blue; time series are for the first 10 min of a 30-min session of a representative subject). (C) Visual and auditory detection time series exhibit LRTCs that may be characterized for each subject by DFA exponents, βV and βA. (D) Amplitude fluctuations of neuronal oscillations in local cortical patches (here, 10 Hz in the inferior parietal gyrus) are fractally self-similar and (E) show robust LRTC. (F) Avalanche dynamics are salient in source-reconstructed broad-band data. The time series of cortical patches in the example avalanche (see also Fig. S3A) are color coded by the peak latency. These colors correspond to those displayed on pial and flattened cortical surfaces and show the progression of this activity cascade from posterior parietal to temporal and postcentral loci. (Bottom) The avalanche time series (black lines) show the number of cortical patches in which a peak was found, with zeros indicating interavalanche periods. (G) The sizes and lifetimes of cortical avalanches are approximately power-law distributed with exponents, α, close to those of a critical branching process (−1.5 and −2, respectively). (H) In line with this notion, the kappa index, κ, for the size distribution is close to 1. All data in this figure are from the same 30-min session of a subject representative in having β closest to population mean.

