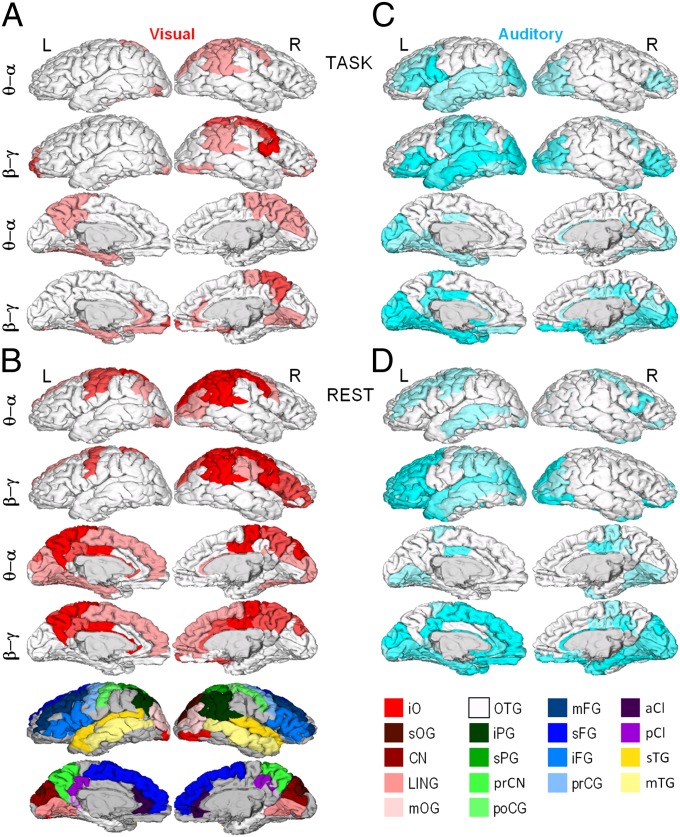
Fig. 3.
Neuronal correlates of behavioral scaling laws. Pearson correlation coefficients were computed between βbehav. and β in the six narrow-frequency bands for each cortical patch (Fig. 2B), and significant (P < 0.05, FDR corrected) correlations were displayed on cortical surfaces collapsed into θ/α (5, 7.5, and 10 Hz) and β/γ (15, 20, and 30 Hz) frequency ranges. For each cortical patch of the Destrieux parcellation, the color intensity indicates the fraction of significant correlations across the three bands (pale, 1/3; medium, 2/3; full, 3/3). (A) Correlation of visual behavioral scaling exponents, βV, with the β of neuronal LRTCs during visual task performance. (B) Correlation of βV with β in separate resting-state data. (C) Correlation of auditory behavioral scaling exponents, βA, with the β of neuronal LRTCs during auditory task performance. (D) Correlation of βA with β in separate resting-state data. a, Anterior; C, central; CI, cingulate; CN, cuneus; F, frontal; G, gyrus; i, inferior; LIN, lingual; m, middle; O, occipital; P, parietal; p, posterior; pr, pre; s, superior; T, temporal. Colors: red, occipital; green, parietal; blue, frontal; yellow, temporal; purple, cingulate. iPG shows the angular part.

