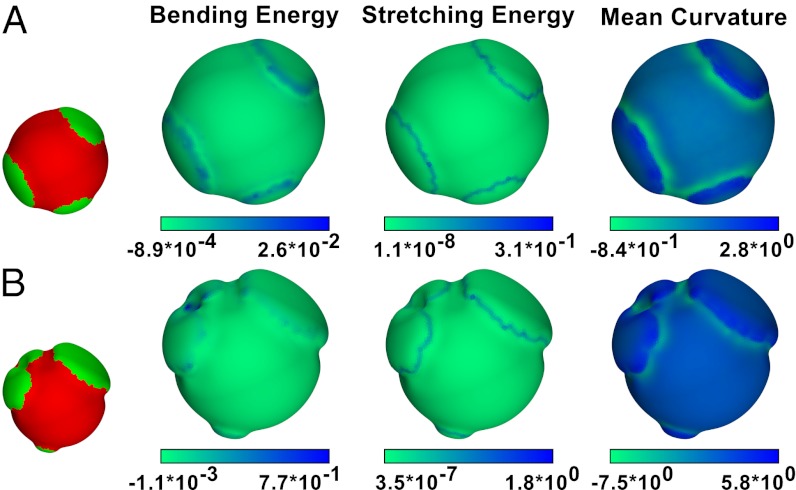
Fig. 4.
Bending and stretching energies per vertex in units of κB with mean curvature per vertex in units of 1/R0. The composition is shown in the small figures on the left for reference. The system in A has MA = 1.2 and f = 0.8, whereas the system in B has MA = 1.5 and f = 0.8, exhibiting larger deformations, where the difference between the minimum and maximum radii in B is approximately two times as large as in A.

