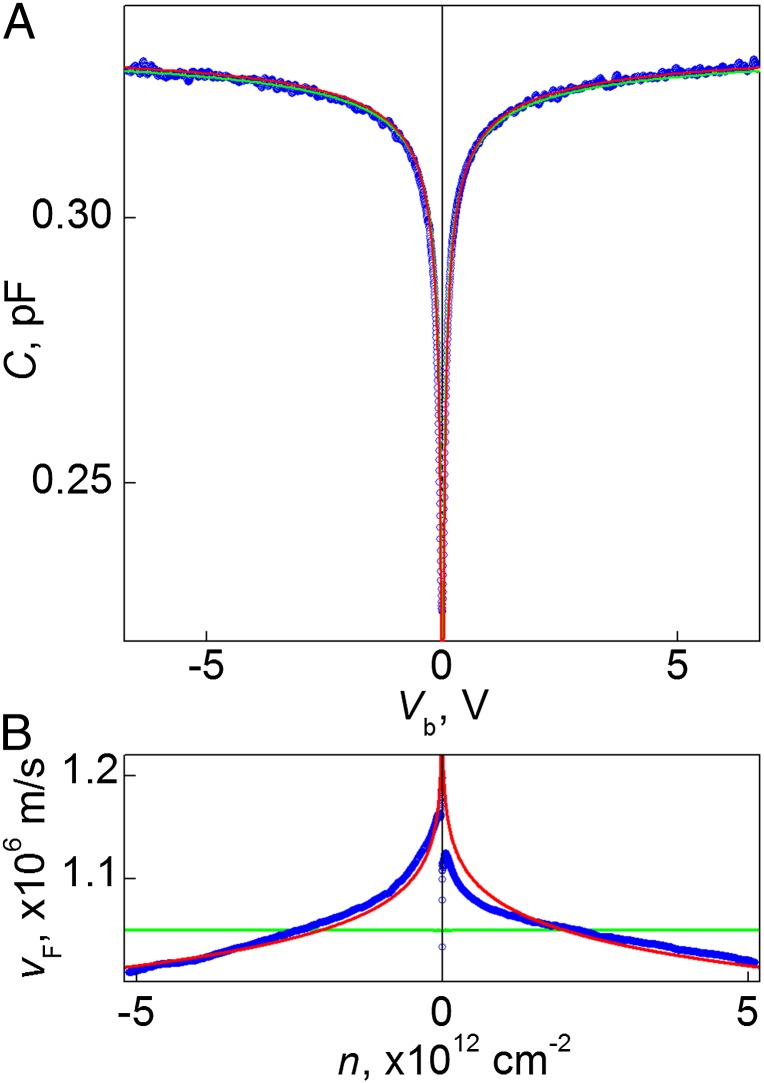
Fig. 2.
Quantum capacitance of graphene. (A) Differential capacitance in zero B. Blue symbols are experimental data; green and red curves are the best fits with constant and renormalized vF, respectively. This particular device has d ∼ 27 nm and S ∼ 250 μm2. (B) Same data replotted in terms of vF and carrier concentration n; color coding as in A.

