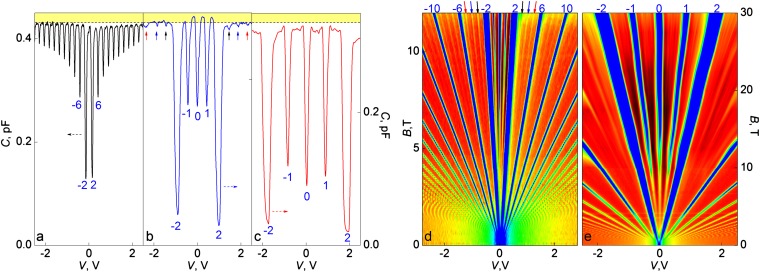
Fig. 3.
Graphene capacitors in quantizing fields. (A–C) Examples of graphene capacitance for B = 3, 15, and 30 T, respectively. Blue numbers are ν for the corresponding minima. The arrows in B mark ν = ±3 (black arrows), ±4 (blue) and ±5 (red). The dashed line indicates CG = 0.433 ± 0.002 pF (for a device shown in A) and 0.335 ± 0.002 pF (for a device shown in B and C). The 15-T curve reveals that the total capacitance becomes higher than the geometrical one at ν around ±1/2 and ±3/2, indicating a negative contribution from CQ, that is, negative compressibility. (D) Two-dimensional map of differential capacitance as a function of B and V for the same device as in A. Color scale is 0.37 pF to CG (blue to green to red) and CG to 0.454 pF (red to black). Numbers and arrows are as in B. (E) Two-dimensional map in B up to 30 T for the device in B and C. Scale: 0.23 pF to CG (blue to green to red) and CG to 0.349 pF (red to black). The dark regions (D and E) correspond to negative CQ.

