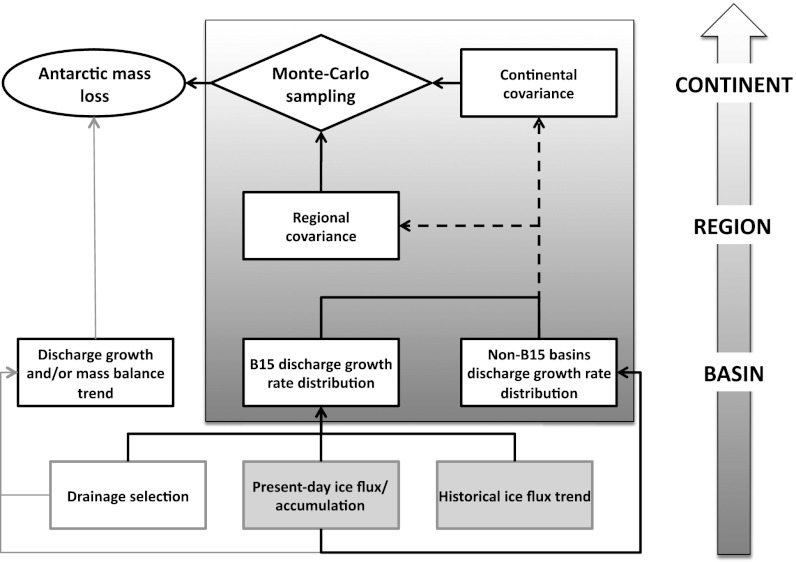
Fig. 1.
Schematic of the methodology used in this paper, with black arrows illustrating the process, and the probabilistic component highlighted in the shaded box. Dashed lines indicate an either/or choice of covariance structure, and observations are shown in boxes with a grey background. For comparison, the process used in previous scenario-based SLR projections (3, 11) is shown with gray arrows.

