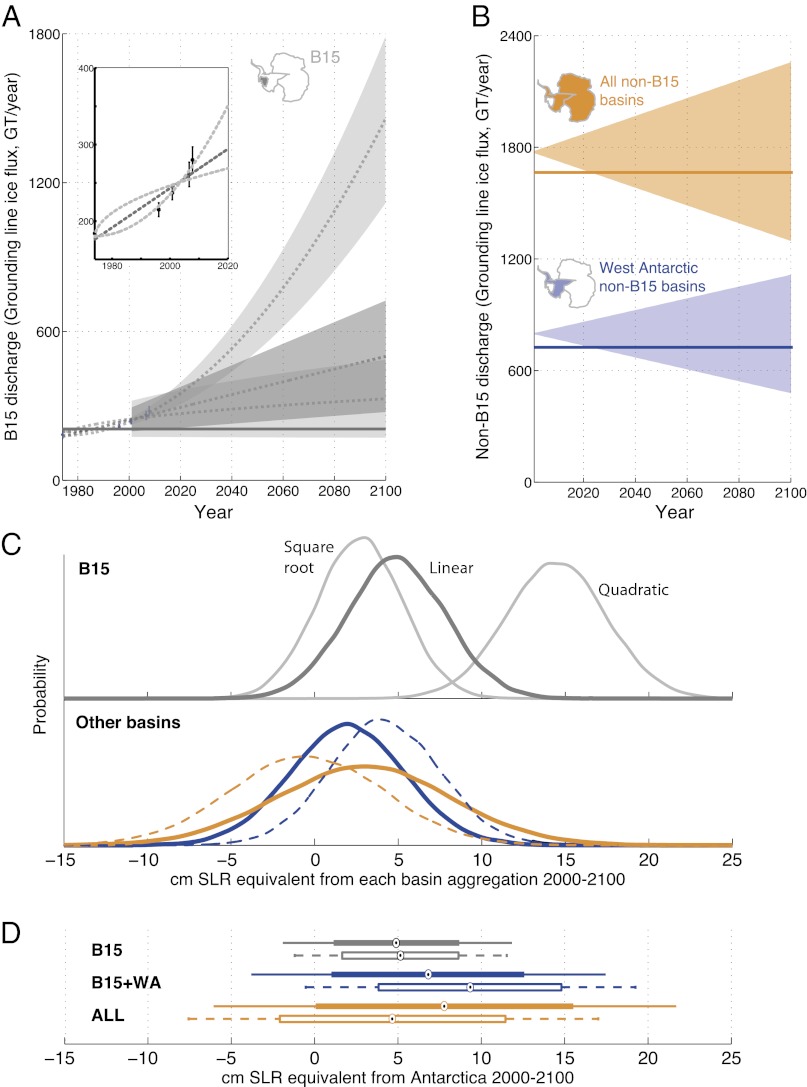
Fig. 3.
Discharge projections and sea level contribution for B15 and non-B15 basins. In A, dashed lines show fits to linear (dark gray) and square root and quadratic (light gray) growth laws. The 10th to 90th percentile range for each growth law over the period of extrapolation is shown with shading (Materials and Methods). In B, 2000–2100 10th–90th-percentile ranges of discharge are shown for non-B15 WA basins and all non-B15 basins using the R08 baseline (σb = 0.5μ15 = 0.73% y−1). Solid lines show the present-day accumulation (196 GT y−1 for B15, 924 GT y−1 for non-B15 WA basins, and 1,866 GT y−1 for all non-B15 basins). (C) Probability distributions of 2000–2100 Antarctic sea level contribution for B15 (gray lines), non-B15 WA basins (blue), and all non-B15 basins (orange). Dashed lines use the Z11 baseline. In D, box plots show the probability distribution using (solid) R08 and (hollow) Z11 baselines for B15, WA and B15, and all Antarctic basins. Circles indicate the median SLR projection, thick lines show 10th–90th-percentile ranges, and whiskers extend to the 1st- and 99th-percentile SLR outcome.

