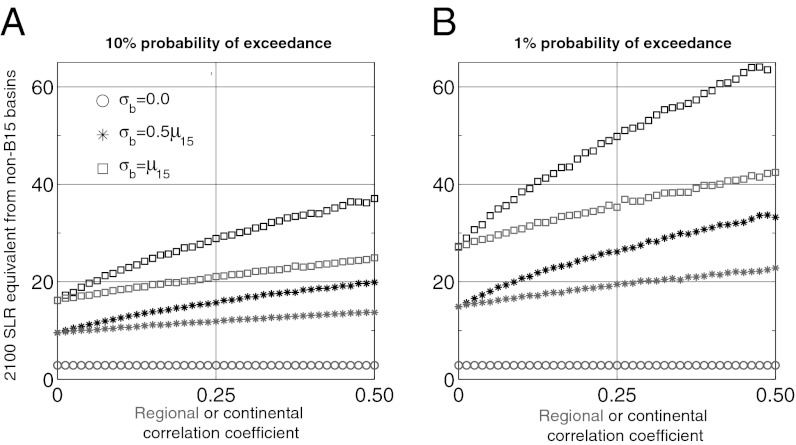
Fig. 4.
Sensitivity to the strength and extent of spatially correlated discharge growth. The upper-bound SLR contribution from all non-B15 basins are shown for three values of discharge growth rate uncertainty (0: circles; 0.5μB15: asterisks; μB15: squares) at different correlation coefficients (gray: regional, ρr; black: continental, ρa). In A, the upper bound is defined as SLR with a 10% probability of exceedance; B uses a 1% exceedance probability. The R08 baseline is used.

