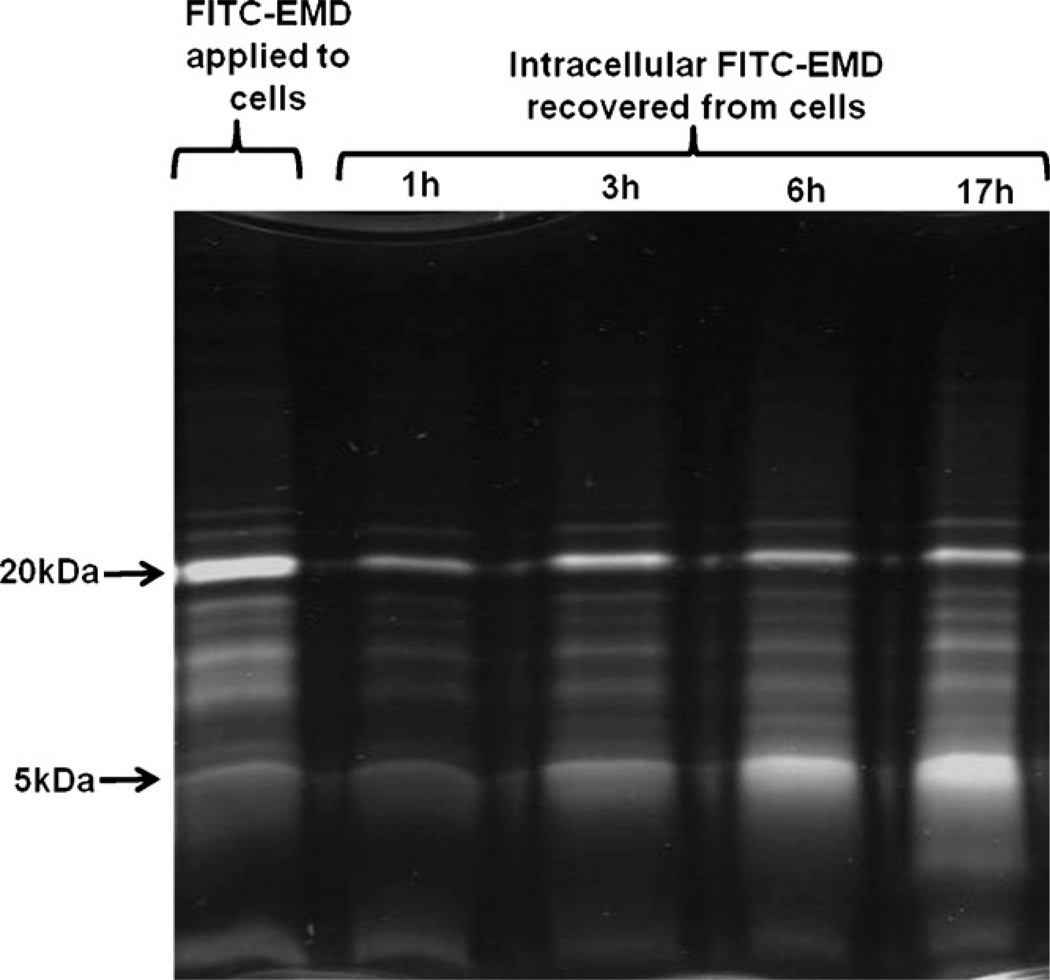
Fig. 3.
SDS-PAGE of whole EMD–FITC (as applied to the cells) and lysates of cells exposed to EMD–FITC for 1–17 h (viewed by UV transillumination). The composition of the intracellular material recovered after 1 h incubation with EMD–FITC conjugate (lane 2) reflected the composition of the applied EMD–FITC (lane 1) with the 20 kDa band being most prominent. Over 17 h there was a gradual accumulation of proteins, especially the 5 kDa protein which accrued to become the dominant band present at later time points (lanes 3–5).

