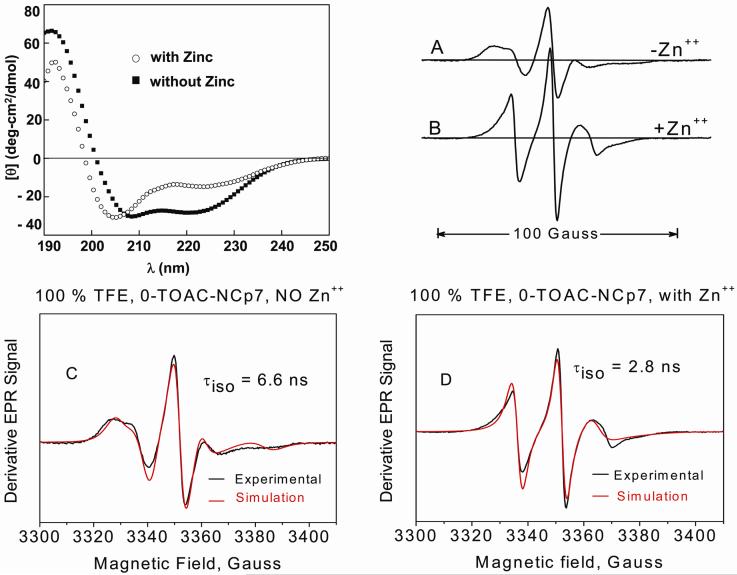
Figure 7.
Left: CD spectra of NCp7 in the (■) absence and (○) presence of zinc in TFE at 5 C. Zinc was added in a 2 fold molar excess to NCp7. EPR spectra right, A: 0-TOAC-NCp7 in the absence (i.e., the apoprotein) and B presence of zinc (i.e., the holoprotein) in 100 % TFE. Spectra were normalized on the second integral. EPR were taken at 5 °C. Spectra C and D respectively compare the experimental EPR spectra of apo-0-TOAC-NCp7 in 100 % TFE and holo-0-TOAC-NCp7 in 100 % TFE with spectral simulations (in red) derived through NLSL methods.50

