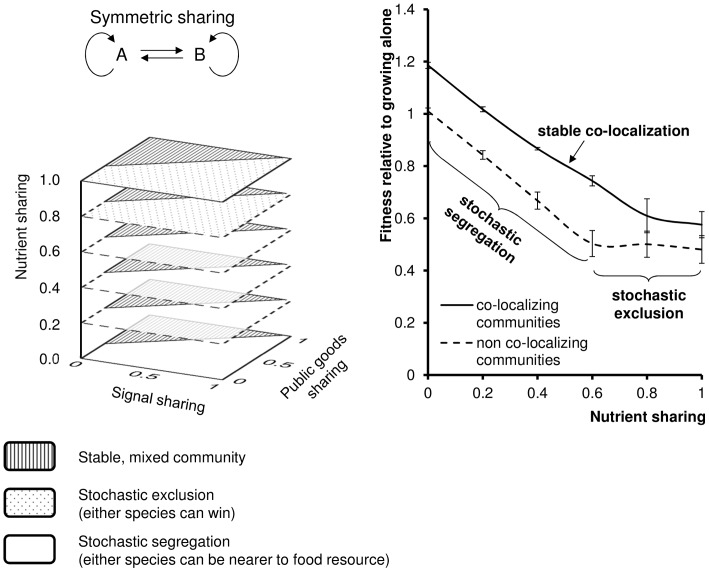
Figure 5. Sharing.
Competition of species A and B that can utilize each other’s signals, public goods and nutrients to a varying extent. a = signal sharing, b = public goods sharing, c = nutrient sharing. Left: regions of co-colocalizing communities (i.e. segregation coefficient is below 0.5, see Methods). Right: Relative fitness of the mixed communities (shaded area on the left) as a function of food sharing (top curve). RF>1 indicates that both species grow faster in a community than alone. Bottom curve: relative fitness of non-colocalizing communities. The values are the average of 10 calculations, error bars represent the standard deviation of the mean.

