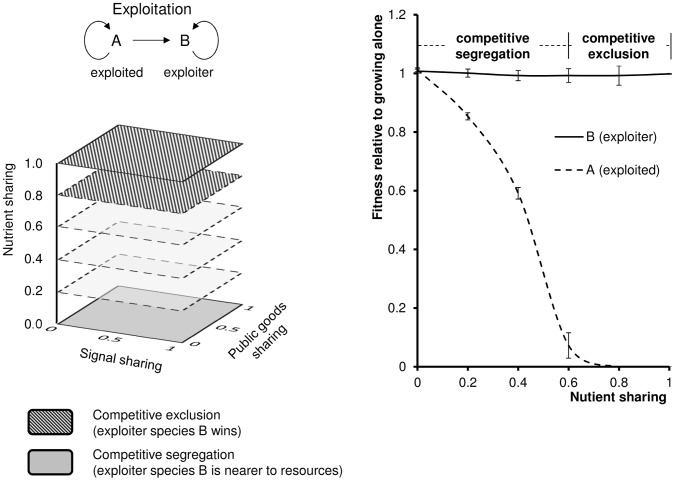
Figure 6. Exploitation.
Species B exploits the QS system (signals, public goods) and nutrients of species A. This provides a fitness advantage to the exploiter species B in the entire parameter range. Left: Regions of the parameter space represent either competitive exclusion or competitive segregation. Right: Fitness of the two species relative to growing alone, as a function of nutrient sharing. Relative fitness = 1 in the top curve indicates that the growth of species B is not hampered by the competition. The values are the average of 10 calculations, error bars represent the standard deviation of the mean.

