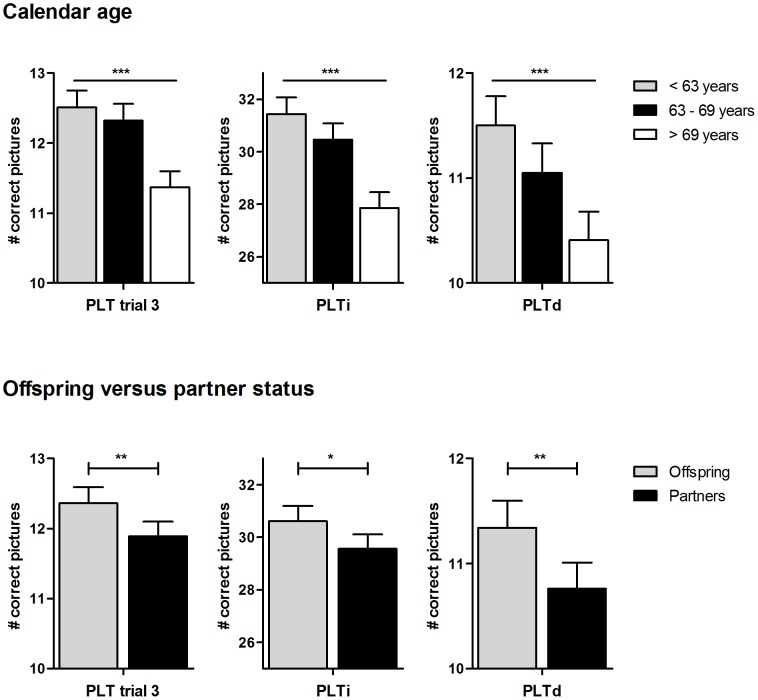
Figure 1. Association of the 15-Picture Learning Test with calendar age and familial longevity.
In the upper and lower panel, estimated mean values for trial 3, the immediate (PLTi) and delayed (PLTd) recall of the 15-Picture Learning Test are shown in tertiles of calendar age and for offspring versus partner status, respectively. Error bars indicate standard error. Analyses on calendar age are adjusted for gender, years of education, diabetes mellitus, cardiovascular diseases, alcohol use, smoking, high-sensitivity C-reactive protein, interleukin-6 and apolipoprotein E genotype. P-values indicate p for trend. Analyses on offspring versus partner status are adjusted additionally for age and for familial relationships among the offspring using robust standard errors. P-values indicate the difference between offspring and partners. ***:p<0.001, **:p<0.01, *p<0.05.

