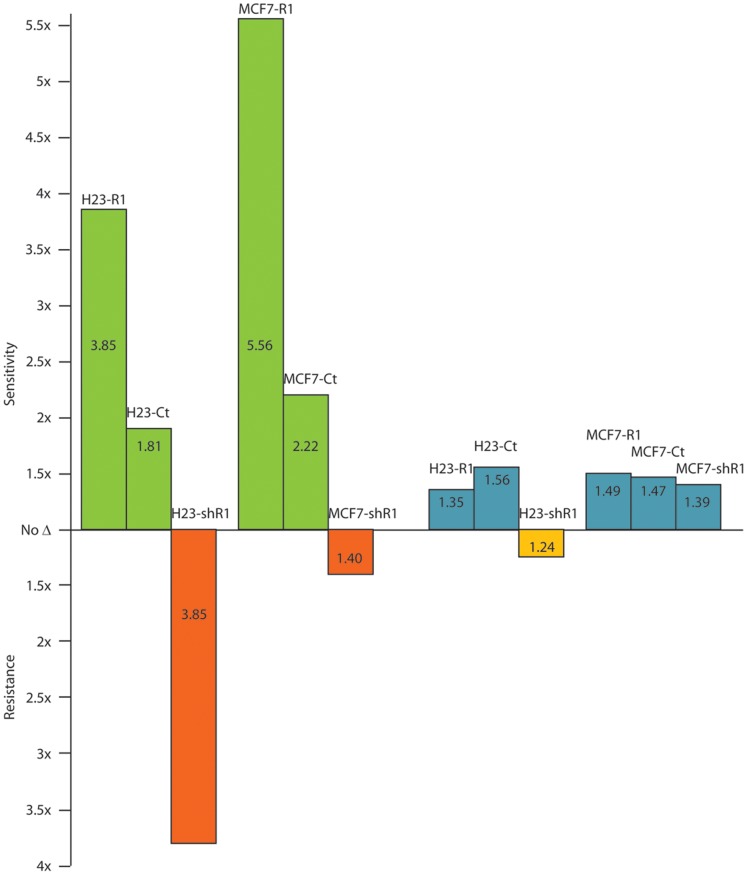
Figure 2. CHK1 and TEC knockdown and RRM1-dependent gemcitabine sensitivity.
The H23 and MCF7 cell line systems with increased (−R1) and reduced (−shR1) RRM1 expression were transfected with CHK1-specific or TEC-specific siRNA and exposed to gemcitabine. IC50 values are the mean of four replicates. CHK1 is depicted in green and red, TEC is depicted in blue and orange.

