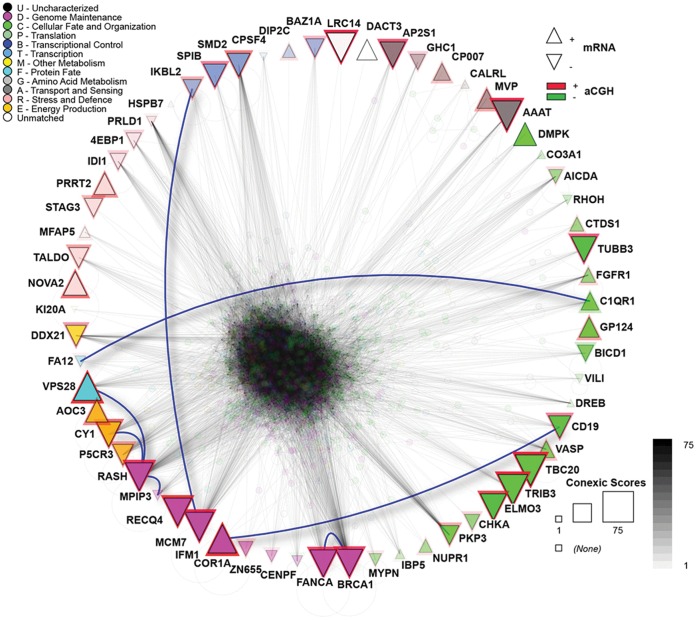
Figure 3. Protein-protein interaction network of 75 modulators.
The 75 modulators were used to query the I2D database to obtain their interacting partners (and also interactions among the modulators). I2D v. 2.0 contained data on 62 modulators, which resulted in a large network of 1,456 proteins and 29,530 interactions. The upward triangles represent up-regulated genes, and the downward triangles represent down-regulated genes. The red and green triangle lines represent genes in amplified and deleted regions, respectively. The biological processes that the modulators are involved are represented by different colours, per the legend, and the triangle size corresponds with the score, i.e., larger triangles depict the highest scores. Direct physical interactions between modulators are represented by blue lines. The remainder of the network is partially transparent to reduce the clutter. The network visualisation and analysis was performed in NAViGaTOR 2.3.

