
Figure 1. Frequency of KIR-ligand genotyping among analyzed subjects.
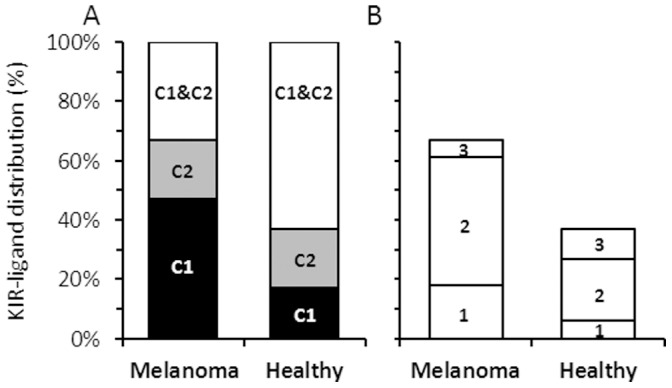
(A) HLA-C KIR-ligands: C1 and C2 represent subjects who are homozygous for HLA-C from group C1 or C2, respectively. C1 & C2 stands for subjects with one allele from C1 and one C2; (B) Number of different KIR-ligand groups identified per subject: “1” stands for only KIR ligand group C1 or C2. “2” means one of the follow combinations: C1 & A (03 or 11), C1 & Bw4, C2 & A (03 or 11) or C2 & Bw4. “3” means C1 & Bw4 & A (03 or 11) or C2 & Bw4 & A (03 or 11).