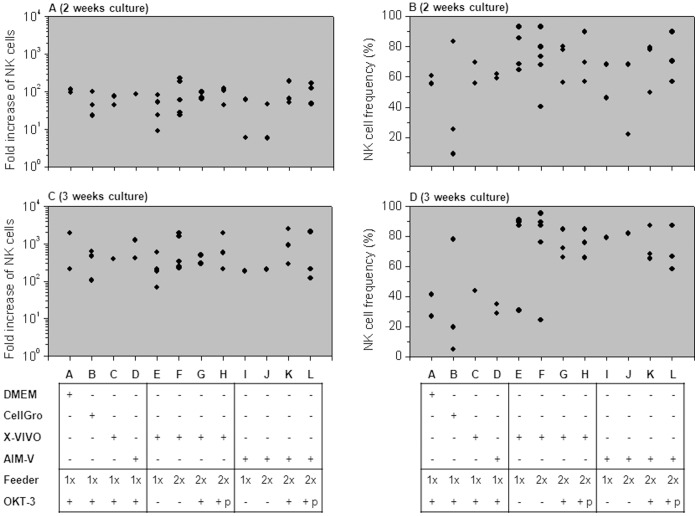
Figure 6. Optimizing ex-vivo expansion and activation.
CD3-depleted cells were cultured under 12 different condition sets as delineated under “A” to “L”. 500 IU/ml IL-2 was present in the culture medium during the entire expansion process. Feeder “1×” refers to supplementing irradiated feeder cells only once at culture initiation and “2×” refers to a second addition of irradiated feeder cells after one week. The ratio of irradiated feeder cells to CD3-depleted cells was always 10∶1. OKT3 “+p” indicates that the first round irradiated feeder cells were pre-incubated (“p”) with OKT3, washed from unbound antibody and then added to the CD3-depleted cells; whereas OKT3 “+” alone indicates that OKT3 was directly added to the ready cell culture comprised of CD3- depleted and irradiated feeder cells. (A) and (C) plots show calculated results of fold increase in NK cell numbers following 2 weeks (A) and 3 weeks (C). (B) and (D) plots show NK cell frequency in percentage out of total cells at each analyzed group presented in A and C respectively. NK cell subset was defined by flow cytometry analysis as the CD56+ CD3- population in gated live cells. Each dot represents the result of an independent experiments performed with CD3-depleted cells from different healthy donors.

