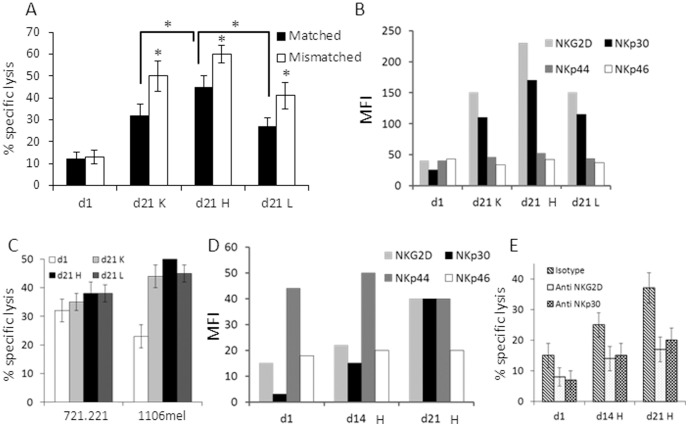
Figure 7. NK cell potency against primary melanoma cultures in relation to NK lysis receptor surface expression following ex-vivo expansion protocols.
Cultured NK cells were analyzed at different time points: ”d1” following culturing with only IL-2 for overnight, “d14” and “d21” indicate 14 and 21 days in culture respectively. The letters “K”, “H” and “L” indicate culture condition set as delineated in Figure 4. (A–B) shows the results of comparing selected culturing conditions: (A) killing activity of representative NK cultures in HLA-C matched and mismatched settings. The mean results of three independent experiments is shown; (B) expression of the indicated NK lysis receptors by the various NK cultures; (C) killing activity of representative NK cultures against MHC class I negative lymphoma cells (721.221) and melanoma cells (1106mel). The mean results of three independent experiments is shown; (D–E) shows the results of comparing different time points along culture in the optimal culturing condition H: (D) expression of the indicated NK lysis receptors by the various NK cultures; (E) killing activity in HLA-C mismatched setting in the presence of IgG1 isotype control antibodies or the indicated blocking antibodies. E:T ratios were 10∶1. MFI means Median Fluorescence Intensity. Figure shows the mean of three independent experiments. *denotes statistical significance in t-tests of P<0.05. Error bars represent SEM.

