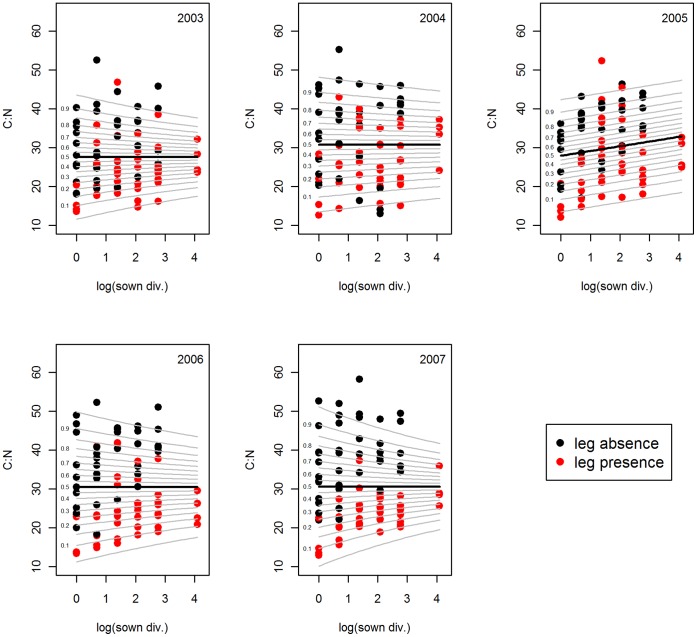
Figure 1. C:N ratio versus plant species richness.
GAMLSS (generalized additive model for location scale and shape) model of the molar C:N ratio versus species richness (natural logarithm) of the years 2003–2007. Black line stands for the mean. For better illustration of the variance, percentiles of the standard deviation are given as grey lines. Sown div. = sown diversity, leg = legume.

