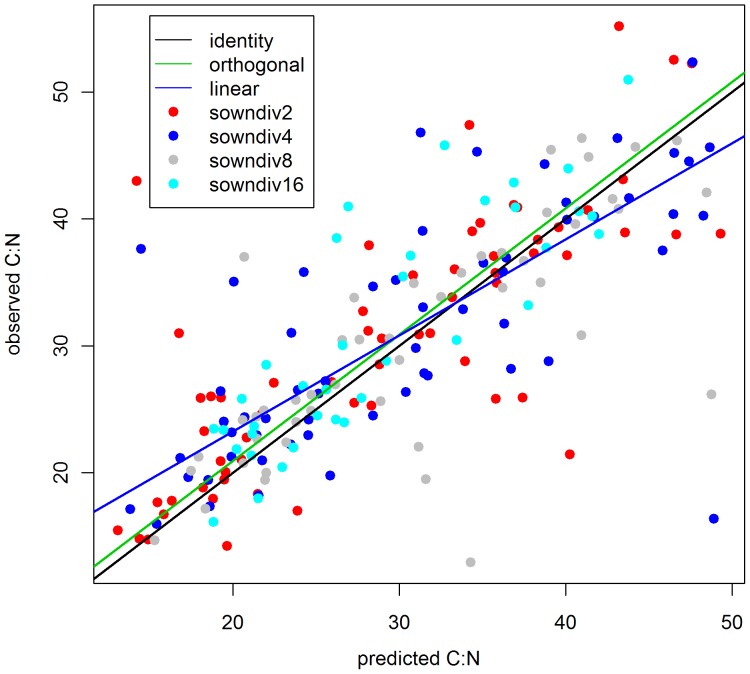
Figure 4. Observed C:N versus predicted C:N ratios.
For every measured C:N ratio (2, 4, 8 and 16 species mixtures) the corresponding calculated C:N ratio is shown across years (2003–2006). The green line gives the fit of an orthogonal regression (intercept 1.03 (SD 0.423); estimated C:N 0.999 (SD 0.043). The blue line gives a linear regression (Intercept 8.1448 (SD 1.434); estimated C:N 0.756 (SD 0.046)). For comparison, identity is given by a black line.

