Fig. 4.

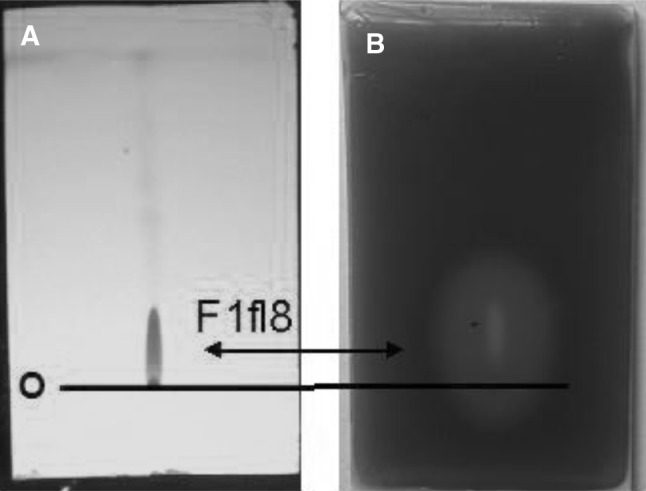
TLC bioassay. a A total of eight spots were visualized on the plate by their fluorescence at 254 nm. b. The control plate was incubated with CV026, Only fraction F1fl8 was active. The “O” marks the position of the origin

TLC bioassay. a A total of eight spots were visualized on the plate by their fluorescence at 254 nm. b. The control plate was incubated with CV026, Only fraction F1fl8 was active. The “O” marks the position of the origin