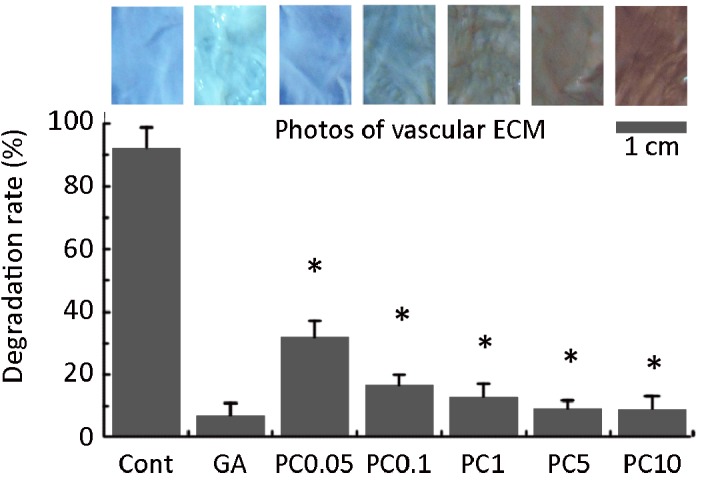
Figure 1.

The appearance (top) of PC-crosslinked ECM against blue background and the degradation resistance of crosslinked ECM to proteolysis by MMP-2 in vitro (Bottom). Cont: control; GA: glutaraldehyde; PC0.01 to PC5 were 0.01, 0.05, 0.1, 1 and 5 mg/mL PC crosslinked ECM, respectively. * represents p < 0.01 compared to control. Scale bar is 1 cm.
