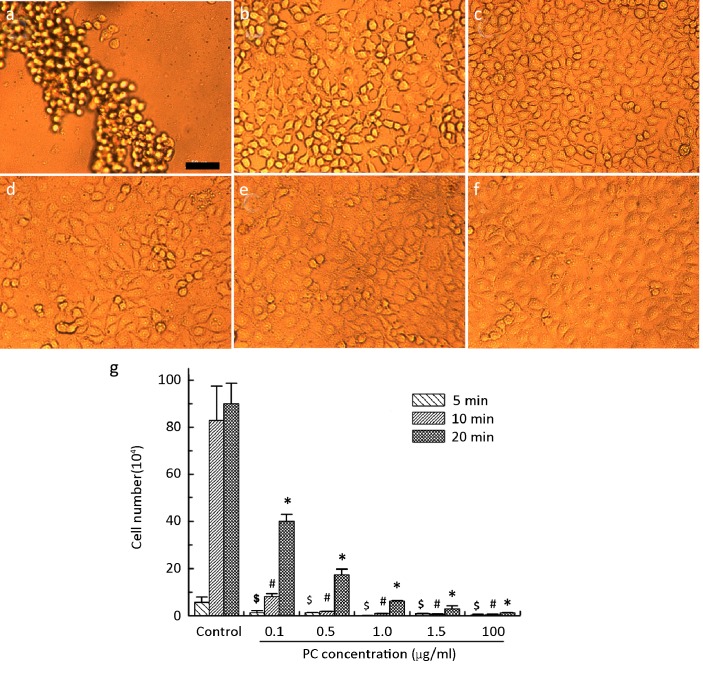
Figure 3.
Detachment of HUVEC cultures treated with 0 (A), 0.1 (B), 0.5 (C), 1 (D), 1.5 (E), and 10 (F) μg/ml PC before enzymatic hydrolysis with 0.5 mg/ml MMP-2 (0.5 ml). (g) The number of cells detached from the PC-pretreated HUVEC cultures for 5, 10, and 20 min after introduction of MMP-2. $, #, and * indicate significant difference (P<0.01) compared to control. Scale bar is 100 μm.

