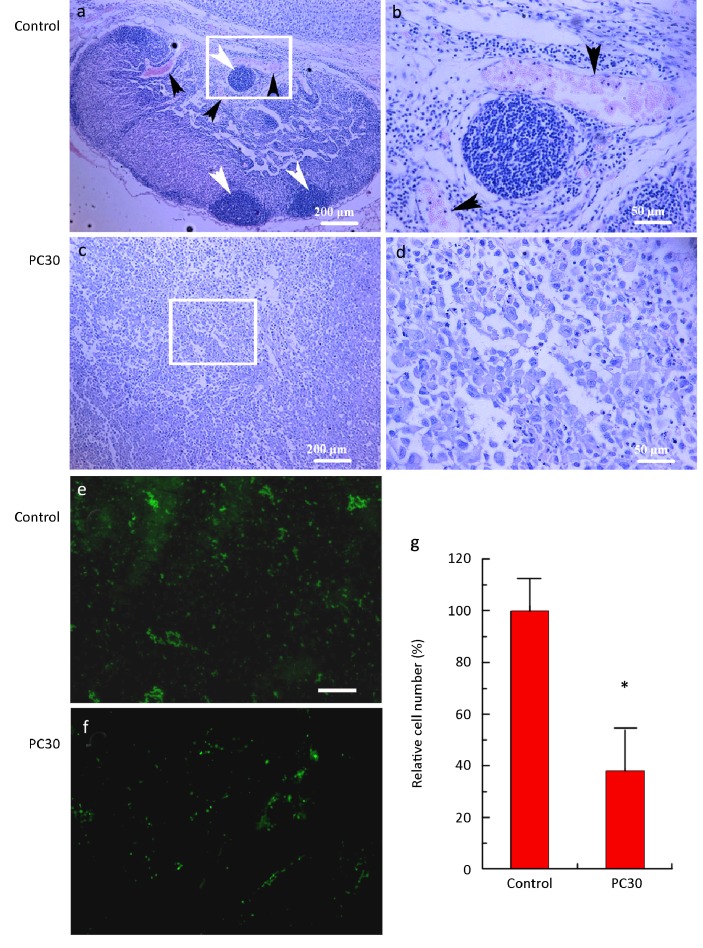
Figure 7.
HE staining of lung adenocarcinoma tissue in control (a) and PC30 (c) treatments. PC30 is 30 mg PC/kg bodyweight. Areas in the white rectangles are magnified 4× for control (b) and PC30 (d) treatments. For (a) and (c), the scale bar is 200 μm. For (b) and (d), the scale bar is 50 μm. White arrow head indicates invasive growth sites. Black arrow head indicates blood vessel. The images (e) and (f) (40×, bar = 200 μm) were the sections probed with anti-cd31+ cells (green). (g) The fluorescence intensity of cd31+ cells normalized to control (n=6). *indicates P<0.05 compared to control.

