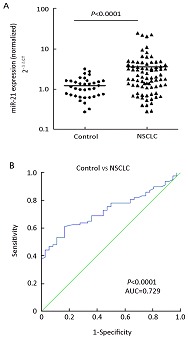
Figure 2.

MiR-21 levels in NSCLC patients and healthy controls. A: Scatter plots of plasma levels of miR-21 in healthy subjects (n=36) and NSCLC patients (n=77). Expression levels of the miR-21(Log10 scale at Y-axis) are normalized to miR-16. The line represents the median value. Mann-Whitney U test was used to determine statistical significance. B: Receiver operating characteristics (ROC) curve analysis using plasma miR-21 for discriminating NSCLC.
