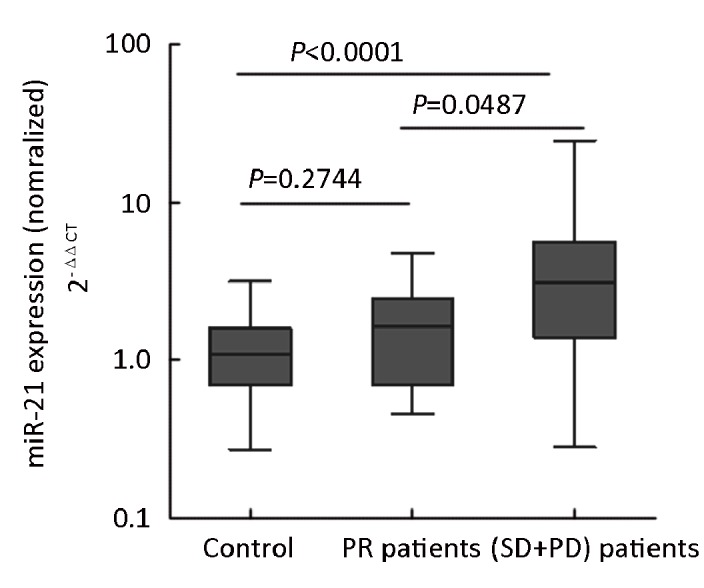
Figure 5.

Analysis of the miR-21 plasma levels in PR and (SD+PD) samples. Expression levels of the miR-21(Log10 scale at Y-axis) are normalized to miR-16. Statistically significant differences were determined using Mann-Whitney U test. PR: partial response; SD: stable disease; PD: progression disease
