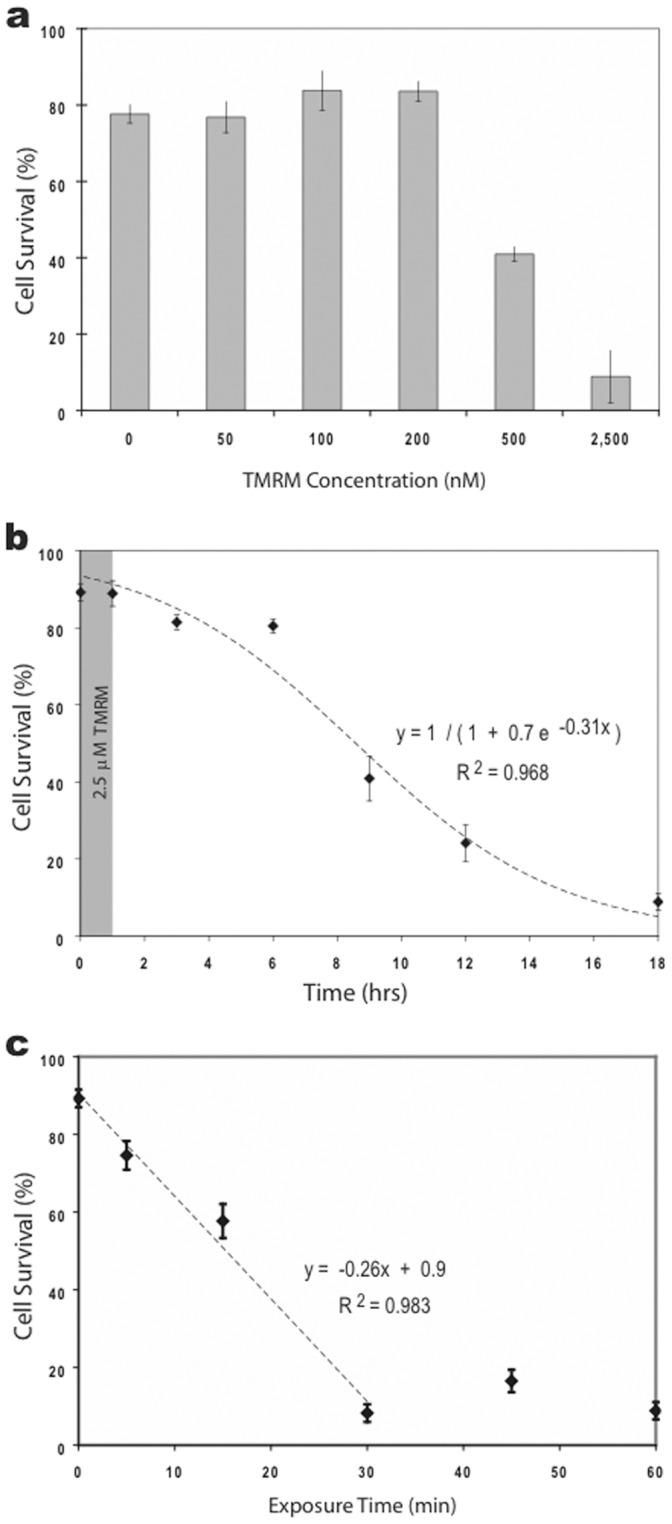
Figure 4. TMRM induced apoptosis in cultured hippocampal neurons.

a. Histogram comparing the effects of different concentrations of TMRM concentrations on cell survivability. Survivability was approximately 80% in control solutions (saline or 2.5 µM DMSO) indicating that exposure to saline, but not DMSO, for 1 hr had a small but measurable effect. Nevertheless, exposure to low concentrations of TMRM (50–200 nM) for 1 hr were not significantly different from controls. Higher concentrations (0.5 & 2.5 µM) induced substantially greater cell death. b. Graph of cell survivability over time following a 1-hr exposure to 2.5 µM TMRM (shaded area). The slow response time is indicative of apoptosis and ruled out necrosis. c. Graph of cell survivability 18 hrs after exposure to 2.5 µM TMRM for different durations (5, 15, 30, 45 and 60 min).
