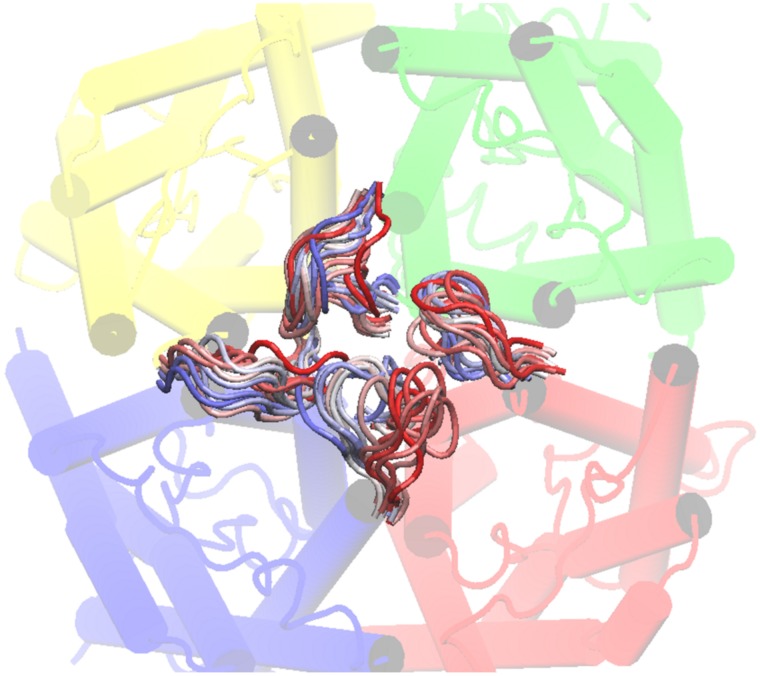
Figure 6. BvPIP2;1 loops A MDS frames superimposition.
The figure shows the MDS for BvPIP2;1 loops A. Each BvPIP2;1 monomer is in a different color; chain A is in yellow, chain B is in green, chain C is in blue and chain D is in red. The superimposition of 30 ns MDS of BvPIP2;1 loops A is shown in a color range, where red is the starting position, white is an intermediate position and blue is the final one.

