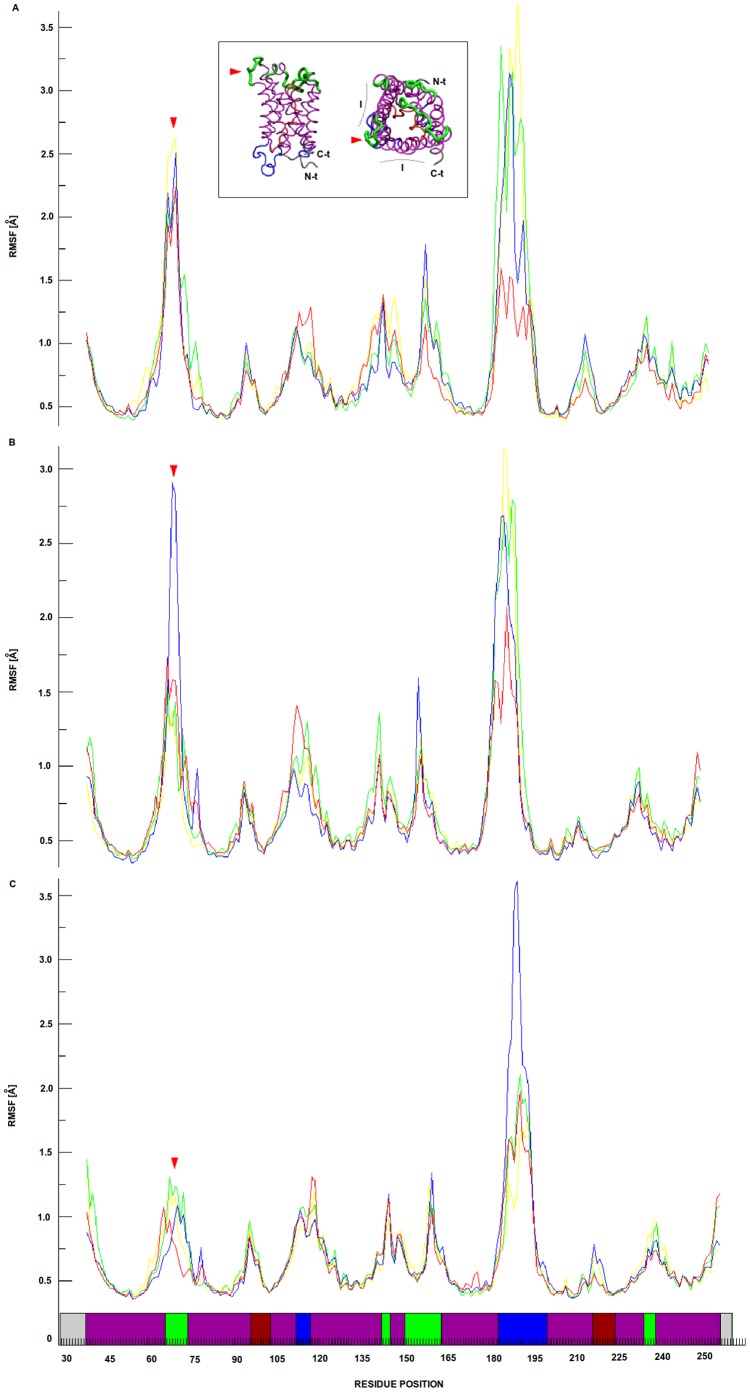
Figure 7. BvPIP2;1 loop A root mean square fluctuation (RMSF).
The RMSF of loops A are shown in yellow, green, blue and red lines corresponding to chains A, B, C and D respectively in all panels. Panels from A to C represent temporal intervals of the MDS ranging from 0 to 10 ns, 10 to 20 ns and 20 to 30 ns respectively. The inset shows the BvPIP2;1 model, where green is used to point extracellular elements of the aquaporin, blue to point intracellular elements, purple to mark alpha helixes, bordeaux to distinguish loops B and E embedded in the membrane region and finally grey to show N-t and C-t. The same color pattern is used in the x-axis of panels to discriminate the location of residues of the primary structure in the protein. In the inset a red arrow is used to point loop A. The figure shows valleys in the RMSF which points that the secondary structure remains stable, the peaks represent movable parts of the protein and comparing extracellular elements, loop A is most flexible than loop C along the whole MDS.

