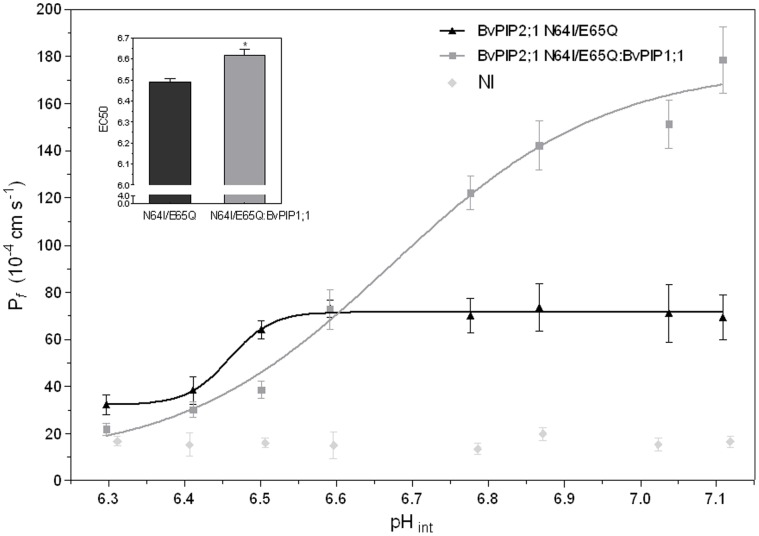
Figure 9. pH dose-response curve of BvPIP2;1 N64I/E65Q mutant and its co-injection with BvPIP1;1.
The effect of cytosolic acidification on Pf was tested on oocytes injected with BvPIP2;1 N64I/E65Q cRNA alone or co-injected with BvPIP1;1 cRNA in a 1∶1 mass ratio. Co-expression of BvPIP2;1 N64I/E65Q:BvPIP1;1 account for a different pH sensitivity in comparison with BvPIP2;1 N64I/E65Q alone. In the main figure values are representative data from three independent experiments using different oocyte batches. For each condition mean values are shown as Pf ± SEM, n = 7−10. Data were fitted to a sigmoidal dose-response curve using Graph Pad Prism (version 3.02). The inset shows mean EC50±SEM, n = 3 independent experiments, EC50 are significantly different (*p<0.05).

