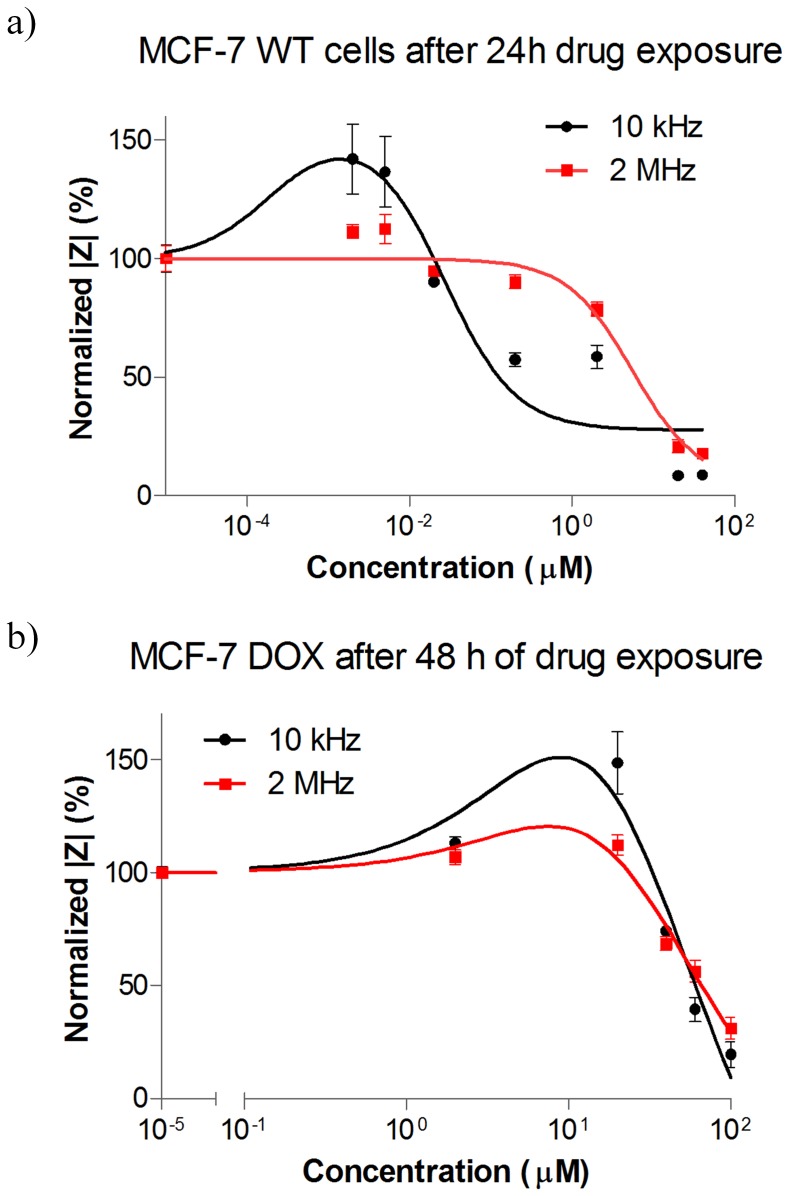
Figure 6. Normalized |Z| vs. different concentrations of doxorubicin at LF (10 kHz) and HF (2 MHz) for a) MCF-7 WT: the LF and HF signals exhibit different profiles with respect to different drug concentrations.
At low drug concentrations, the LF signal increased when HF signal was unaltered. At mild drug concentrations such as 0.2 µM doxorubicin, the LF signal decreased with no change in HF signal. At high drug concentrations such as 20 µM and 40 µM doxorubicin both LF and HF signal decreased sharply, showing similar kinetics. b) MCF-7 DOX: the LF signal increases at non-lethal drug concentrations when HF signal exhibited a slight increase. At high drug concentrations such as 40 µM and higher, the LF and HF signal displayed similar impedance profiles and dropped sharply. The plots were fitted by nonlinear regression based on the equation for bell-shaped concentration response only for visual presentation. Data points (mean ± SEM, n = 5) were normalized to the magnitude value at t = 0 h.

