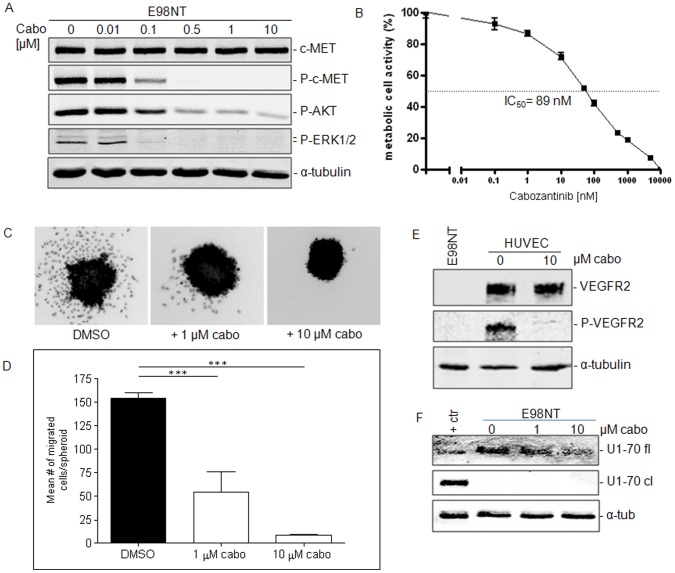
Figure 2. In vitro effects of Cabozantinib on c-MET and VEGFR2 signaling.
Panel A shows a Western blot of E98NT cell extracts (20 µg per lane) treated for 30 minutes with different concentrations of cabozantinib as indicated. Protein extracts were analyzed for c-MET, phospho-c-MET, AKT, and ERK1/2, using α-tubulin as a loading control. B) MTT assays were done to determine the IC50 concentration of cabozantinib on E98NT cells. Experiments were performed at least in triplicate. C) Effects of cabozantinib on cell migration. Shown are representative examples of DAPI-stained spheroids after 24 hr incubation with indicated concentrations. Number of outgrowing and migrating cells per spheroid are shown in panel D (***: p<0.001). Number of migrating cells were significantly different between groups (one-way ANOVA, p<0.0001). Post-hoc Tukey's Multiple Comparison Test revealed significant differences groups as indicated (***: p<0.001). E) Western blot of cell lysates of E98NT and HUVEC extracts, treated with 10 ng/ml VEGF with or without cabozantinib, and stained for VEGFR2, phospho-VEGFR2 and α-tubulin as an internal control. Note the absence of VEGFR2 in E98NT cells. F) Western blot of treated E98NT cell extracts with the anti-apoptotic antibody U1-70. Control sample consists of Jurkat cells treated with anisomycin.

