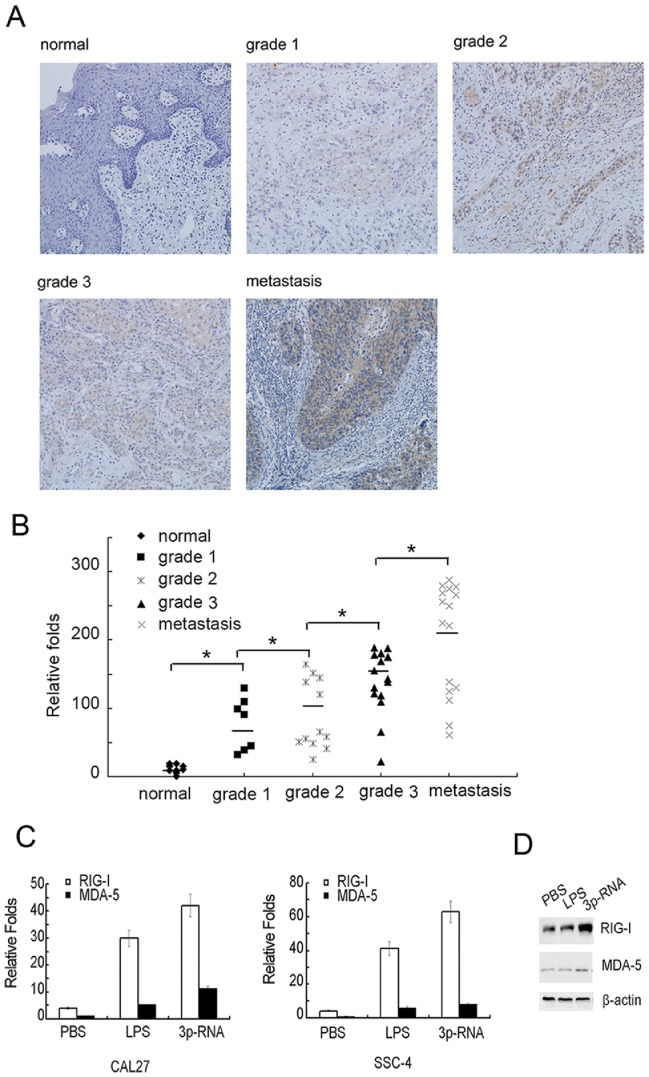
Figure 1. RIG-I is highly expressed on HNSCC cells.
(A) Representative results of immunohistochemical staining of RIG-I protein (yellow) in HNSCC tissue samples. Photos were taken under 200× magnification. (B) mRNA expression of RIG-I in HNSCC tissue samples same to Table 1 were analyzed by Q-PCR, the lowest expression of RIG-I in normal control sample as control (*, P<0.001, n = 61, ANOVA). (C) CAL27 or SCC4 cells (5×10⁵ per well) were plated in 12-well plates overnight and then stimulated with PBS or LPS for 12 h or transfected with 100 ng/ml 3p-RNA for 16 h. mRNA expression levels of RIG-I and MDA-5 were analyzed by Q-PCR. The basal level of MDA-5 normalized by β-actin was used as the control. (D) CAL27 cells (2×10⁶ per well) were plated in 6-well plates and stimulated as in (C). Protein expression levels of RIG-I and MDA-5 were determined by Western blot with β-actin as the loading control.

