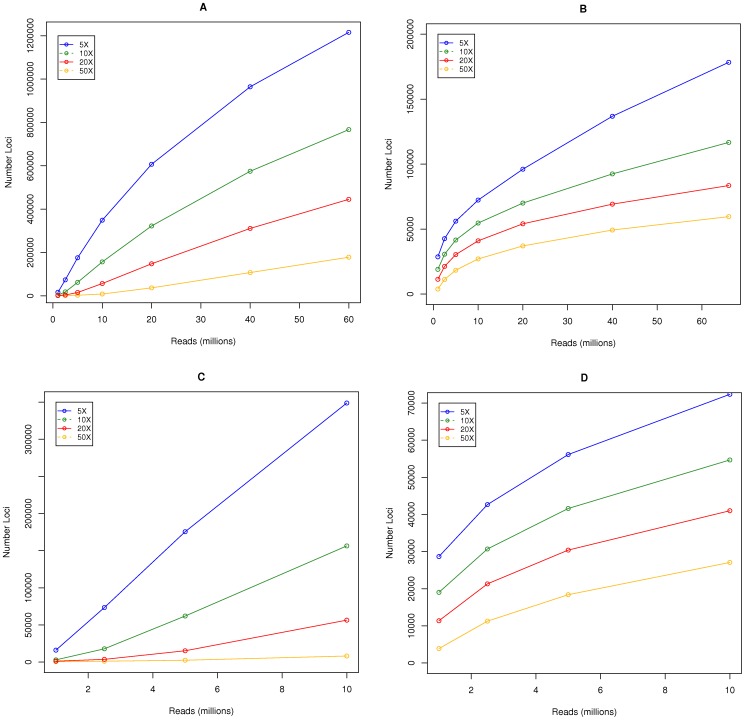
Figure 1. Genotyping potential using different restriction enzymes.
Estimating the number of loci we can potentially genotype after genome complexity reduction with (a) ApeKI, and (b) PstI., Plots zoomed in on low sequencing budgets are shown in (c) ApeKI and (d) PstI. Reads were randomly sampled to represent different sequencing budgets, and mapped back to the consensus loci that were generated by merging reads into matching stacks with ustacks. The number of loci achieving a 5, 10, 20, and 50X coverage are shown. Note: the scale of y-axis differs between plots.

