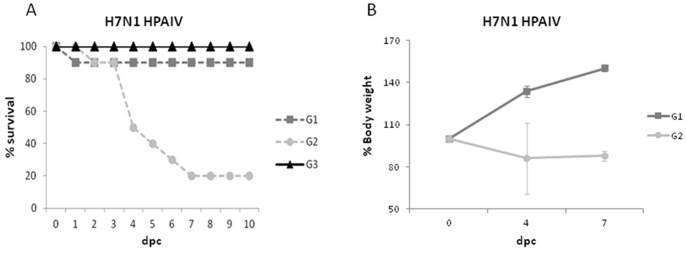
Figure 1. Lethality and weight loss in chickens after challenge with H7N1 HPAIV.

(A) Survival curves (in percentage) of SPF-chickens from G1 (pre-exposed to H7N2 LPAIV), G2 (positive control) and G3 (negative control) after H7N1 HPAIV-challenge. (B) Weight loss curves of SPF-chickens from G1 and G2 after infection with H7N1 HPAIV. Mean %-body weight of animals normalized to initial weight ± SD is represented.
