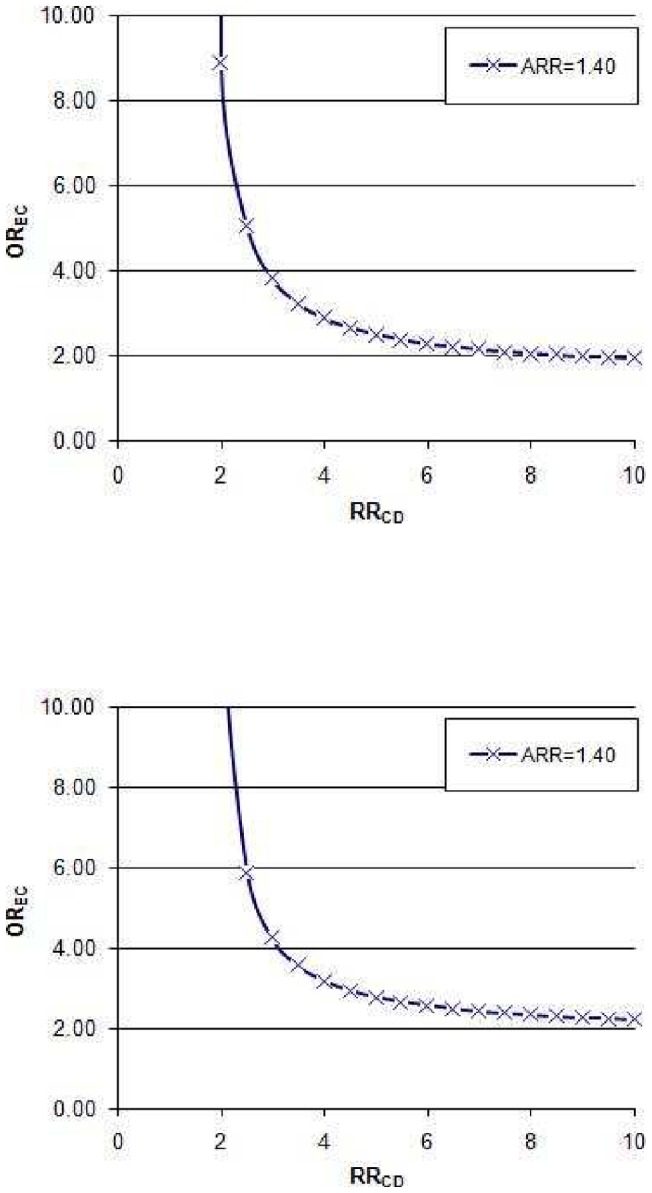
Figure 5. Influence of a hypothetical dichotomous confounder present in 20% (panel A) and 40% (panel B) of the study population, unaccounted for in prior adjustments performed in individual studies.

The graphs depict what combinations of OREC and RR would be necessary for the confounder to fully account for the observed association between H2RA use and CDI acquisition. Abbreviations: OREC, odds ratio of exposure to the confounder in H2RA non-users vs. H2RA users; RRCD, relative risk of CDAD in individuals exposed to the confounder vs. non-exposed.
