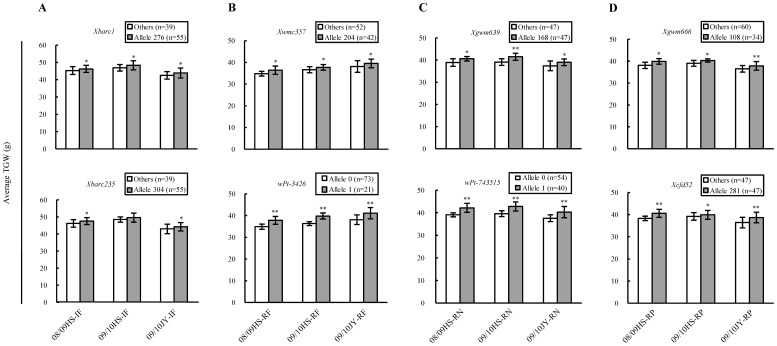
Figure 4. Phenotypic effects of the loci associated with thousand-grain weight (TGW) (g) in the irrigated and fertilised (IF), rainfed (RF), reduced nitrogen (RN), or reduced phosphorus (RP) environments as assessed through marker allele-assisted genotyping.
For the microsatellite loci (Xbarc1, Xbarc235, Xwmc357, Xgwm639, Xgwm666, and Xcfd52), the elite alleles are represented by the actual size of specific amplicons (Allele 276, Allele 304, Allele 204, Allele 168, Allele 108, and Allele 281 for the six loci, respectively), with “Others” denoting inferior alleles. For the diversity arrays technology (DArT) loci (wPt-3426 and wPt-743515), the elite (indicated by Allele 1) and inferior (represented by Allele 0) alleles refer to the presence and absence of their corresponding DArT sequences, respectively. (A-D) Comparisons of the phenotypic effects between the elite and inferior alleles of the associated loci on the average TGW across the three IF, RF, RN, or RP environments. The number of lines (n) in each varietal group is provided in brackets. *and **indicate statistical significance at P≤0.05 and 0.01, respectively.

